Downloads
 Download


This work is licensed under a Creative Commons Attribution 4.0 International License.
Article
Many-Objective Simulation Optimization for Camp Location Problems in Humanitarian Logistics
Yani Xue 1,*, Miqing Li 2, Hamid Arabnejad 1, Diana Suleimenova 1, Alireza Jahani 1, Bernhard C. Geiger 3, Freek Boesjes 4, Anastasia Anagnostou 1, Simon J.E. Taylor 1, Xiaohui Liu 1, and Derek Groen 1,*
1 Department of Computer Science, Brunel University London, Uxbridge, United Kingdom
2 School of Computer Science, University of Birmingham, Birmingham, United Kingdom
3 Know-Center GmbH, Graz, Austria
4 Faculty of Geosciences, Utrecht University, Utrecht, The Netherlands
* Correspondence: Yani Xue (Yani.Xue3@brunel.ac.uk); Derek Groen (Derek.Groen@brunel.ac.uk)
Received: 10 March 2024
Accepted: 19 August 2024
Published: 26 September 2024
Abstract: Humanitarian organizations face a rising number of people fleeing violence or persecution, people who need their protection and support. When this support is given in the right locations, it can be timely, effective and cost-efficient. Successful refugee settlement planning not only considers the support needs of displaced people, but also local environmental conditions and available resources for ensuring survival and health. It is indeed very challenging to find optimal locations for establishing a new refugee camp that satisfy all these objectives. In this paper, we present a novel formulation of the facility location problem with a simulation-based evolutionary many-objective optimization approach to address this problem. We show how this approach, applied to migration simulations, can inform camp selection decisions by demonstrating it for a recent conflict in South Sudan. Our approach may be applicable to diverse humanitarian contexts, and the experimental results have shown it is capable of providing a set of solutions that effectively balance up to five objectives.
Keywords:
facility location problem many-objective optimization simulation evolutionary algorithms1. Introduction
Forced displacement is the movement of people forced to flee from their home or origin countries due to conflict, violence, persecution, or other push factors. It has become increasingly prominent in recent years with at least 117.3 million people forcibly displaced worldwide in 2023 (UNHCR: 2024 [1]). Over a third of these people crossed borders to seek protection and/or asylum (UNHCR: 2024 [1]).
Refugee camps are a form of settlement for protecting forcibly displaced people and ensuring their survival and health. Establishing camps in the most suitable locations is vital for enabling timely, effective, and cost-efficient humanitarian support, but also challenging. Estrada et al. [2] have shown how camp selection can be presented as an example of the generic facility location problem (FLP). The FLP has been widely studied in humanitarian logistics (in the context of earthquakes [3], hurricanes [4], floods [5], and epidemics [6, 7]) to determine the optimal locations of distribution centers, warehouses, shelters, and medical centers. Its application to camp placement selection is important due to the rapid emergence of new conflict situations across the globe, and the resulting need to effectively assist forcibly displaced people in their country of asylum.
Applying the FLP in this context is challenging because refugee camp selection decisions are made in a complex political and physical environment, and often have many uncertain elements (e.g. due to the unpredictable nature of the nearby conflict). For successful refugee camp planning, decision-makers should consider not only commonly used objectives for FLPs such as travel distance, demand (i.e., the number of affected people) coverage and the facility usage rate. They also need to account for local environmental conditions, such as site accessibility and optimal food availability for ensuring survival and health. To satisfy the different needs of multiple stakeholders (governments, non-governmental organizations, and asylum-seekers/unrecognized refugees) we formulate the FLP as a many-objective optimization problem (MaOP), i.e., one that optimizes more than three objectives simultaneously.
A number of approaches for many-objective FLP have been proposed, which include traditional -constraint [8] and goal programming [9] approaches. More recently, metaheuristic optimization algorithms have been adopted for solving different MaOPs. Some representatives include the evolutionary algorithm (EA) and the particle swarm optimization (PSO) algorithm, which have been widely employed in many fields (e.g., engineering [10, 11], healthcare [12, 13], logistics [14], and finance [15]). EAs are popular population-based metaheuristic optimization algorithms, which have been demonstrated to be effective in solving complex problems including MaOPs because of their ability to approximate a set of optimal solutions in a single run. Furthermore, EAs have been extensively used for tackling FLP in emergency management after natural disasters (e.g., hurricanes, earthquakes, and floods) [16].
Here we propose a simulation-based evolutionary many-objective optimization approach to solve the camp location problem in the context of forced migration. This problem is formulated as an MaOP involving five objectives, i.e., minimizing traveling distance, maximizing the number of camp arrivals, minimizing the amount of excess capacity, maximizing food security, and maximizing the accessibility level. In the proposed approach, the employed EA searches for the possible suitable locations that satisfy these objectives calculated by an agent-based simulation (Flee [17]) and external data sources. The proposed approach takes advantage of the searching abilities of population-based meta-heuristic optimization approaches and the forecasting ability of agent-based simulation for the movements of asylum-seekers/unrecognized refugees. In contrast to single-objective optimization approaches converting the many-objective problem into a single-objective one, the employed multiobjective EAs (MOEAs), which search for the whole Pareto front of an MaOP, have been demonstrated to be more promising as they can help the search jump out of the local optima [18]. To show its performance, we conduct a case study of a recent South Sudan conflict and the experiments are based on popular MOEAs and a baseline algorithm. The experimental results demonstrate that the proposed approach can provide a set of solutions that well balance the aforementioned objectives.
The rest of this paper is organized as follows. Section II reviews the related work. Section III presents the description and definition of the problem. Section IV gives the details of the proposed simulation-based many-objective optimization approach. The results are shown and discussed in Section V. Finally, Section VI concludes the paper.
2. Related Work
The camp location problem is often both essential and complex for humanitarian organizations in aid deployment to consider. Existing literature that can inform this consideration generally falls under two categories: 1) modeling the movement of asylum-seekers/unrecognized refugees [19], and 2) FLP in humanitarian logistics [3, 8, 9, 20]. In this paper, we aim to address the camp location problem for asylum-seekers/unrecognized refugees. This problem can be formulated as an MaOP.
Current approaches related to many-objective FLP can be roughly classified into two groups. One group refers to traditional single-objective optimization approaches, e.g., the weighted sum approach, the goal programming approach, and the -constraint [8, 9, 20]. Manopiniwed and Irohara [20] adopted a normalized weighted sum method to select the optimal locations of the local relief distribution centers for disaster response, and showed that it could provide a set of solutions that balance the two objectives, e.g., minimizing the total cost of opening distribution centers and shipping relief supplies as well as minimizing the maximum response time. In addition, Barzinpour and Esmaeili [9] developed a goal programming approach to solve a multiobjective location-allocation model for the preparation planning phase of disaster management, with the objectives of maximizing the cumulative coverage of the population, minimizing the facility setup costs, and minimizing the total transportation costs, equipment holding costs, and shortage penalty costs. Similarly, Hallak et al. [21] proposed a weighted-goal programming approach to seek optimal shelter locations for internally displaced persons in Idleb, Syria. The objectives of this model include the maximization of demand coverage and humanitarian vulnerability criteria, and minimization of cost. Furthermore, Cilali et al. [8] presented an augmented -constraint method for refugee resettlement, and considered four objectives simultaneously, i.e., maximizing the number of resettled refugees, minimizing the total cultural distance, minimizing the cost of preparing resettlement locations, and minimizing the weighted travel distance.
The other group includes the optimization approaches aiming at searching for the whole Pareto front, so that the decision-maker could select the solutions depending on their preferences. Atta et al. [22] developed a novel Pareto optimality-based multiobjective harmony search algorithm (MOHSA) to address a multiobjective variant of the maximal covering location problem, with the objectives of maximizing both the demands and the preferences of customers served by the opened facilities. The results showed that MOHSA is comparable with the traditional MOEA, i.e., non-dominated sorting genetic algorithm II (NSGA-II) [23], regarding performance metrics and statistical tests, and requires less runtime than NSGA-II. Ghasemi et al. [3] employed the classic NSGA-II and a multiobjective variant of the PSO algorithm to tackle a multiobjective location-allocation problem for earthquake evacuation planning, aiming at minimizing the total cost of facilities and minimizing the amount of shortage of relief supplies. Moreover, Wang et al. [24] designed a dual-population based EA to deal with a FLP under the uncertainty of facilities, involving the objectives of maximizing the coverage reliability, minimizing the response time, and minimizing the cost. Furthermore, some heuristics have been combined. For example, Wang et al. [25] proposed an ISA-PSO algorithm, where the ISA (an improved simulated annealing algorithm based on genetic algorithm) is combined with the PSO to determine the selection of emergency shelters, medical centers, and the distribution centers for disaster management, with the aim of minimizing the evacuation distance, cost, and unmet resources.
We consider the second group because the optimization approaches in the first group may need to provide some prior knowledge of the problem, such as the weights (i.e., relative importance) between the objectives in the weighted sum approach. Such knowledge can be difficult to access. For example, the decision-maker is often not confident enough to specify the weights (i.e., to quantify relative importance) between the objectives. Moreover, a very recent study suggests that even if the weights can be accurately specified, the optimization approach searching for the whole Pareto front is more promising as it can help the search jump out of the local optima [18].
The research in many-objective FLP can be further explored by investigating the optimization approach for many-objective FLP under uncertainty. Due to the uncertain nature of FLP in humanitarian operations, such as the randomness of large-scale asylum-seeker/unrecognized refugee movements, it is difficult or even impossible to obtain reliable demand information. Recently, a number of stochastic or robust models for FLPs under uncertainty have been presented [26], but few of these models consider the uncertainty of the number of asylum-seekers/unrecognized refugees arriving in destination countries.
Some studies have developed different agent-based migration modeling frameworks, which are popular simulation approaches for modeling the movements of displaced persons [19]. In this study, we formulate objective functions related to asylum-seekers/unrecognized refugees according to the simulation results. Using simulation to calculate objectives has been successfully applied to many fields, such as healthcare, logistics, supply chain, environment, and manufacturing [27].
3. Problem Description and Formulation
3.1 Problem Description
We consider a FLP in which humanitarian organizations or governments locate a new camp to satisfy the needs of displaced persons. Considering the uncertain nature of FLP in humanitarian operations, such as the randomness of large-scale movements of asylum-seekers/unrecognized refugees, it is difficult or even impossible to obtain reliable demand information. Some models have been developed to predict the movements of asylum-seekers/unrecognized refugees. For example, the Flee agent-based simulation model provides a way of rapidly facilitating simulation development when a conflict occurs and forecasting the distribution of asylum-seekers/unrecognized refugees in different camps [19]. The FLP is constructed based on the Flee simulation for incorporating the uncertainty related to forcibly displaced people, and it consists of five main steps. In the first step, we create a source country that involves the points representing conflict zones and towns along with all possible links between these points. In the second step, we place a point (i.e., camp) at the given coordinates in a destination country. In the third step, we create a link between the camp and its nearest location in the source country. In the fourth step, we run the Flee simulation, and finally, in the fifth step, we assess the objectives related to individual travel distance and the number of people who arrived in the camp during the simulation period.
Figure 1 illustrates the route network for a basic FLP. It contains three types of points, which include conflict zones, towns, and camps, as well as those links between those points, i.e., interconnecting roads. The position of a point is represented by the coordinates associated with the point. Note that the and coordinates of the camp are two input parameters of the simulation module of our approach.
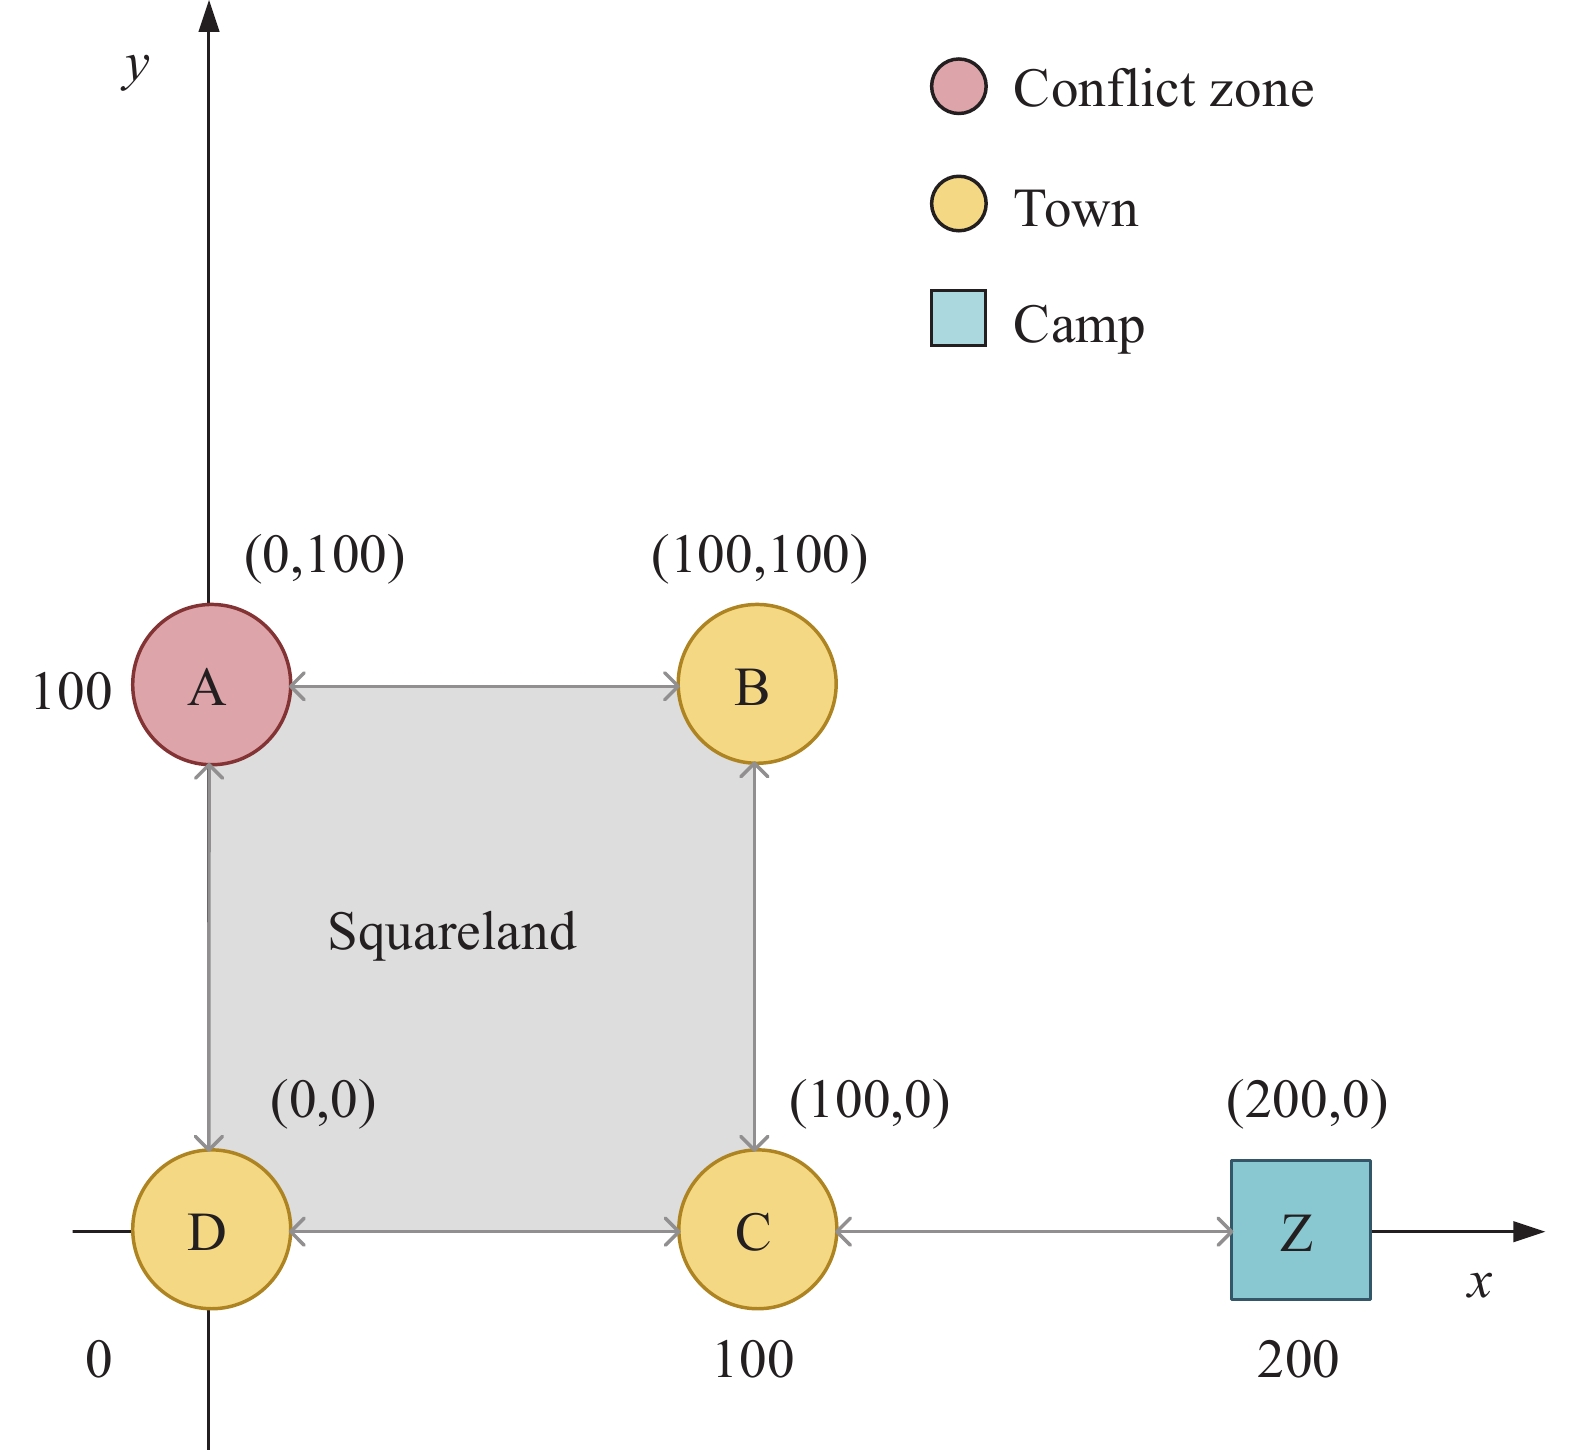
Figure 1. An illustration of the route network of a basic FLP which includes five points (i.e., one conflict zone, three towns, and one camp to be placed) and links (i.e., interconnecting roads) between these points, which is adapted from Xue et al. [28].
The following decision shall be made for our model: given a source country with a set of locations (including conflict zones and multiple towns) and all possible routes between these locations, where is the best camp location in the destination countries?
Assumptions for the model are as follows:
1) The locations of conflict zones and towns in the source country are given.
2) Forcibly displaced people (known as agents in the Flee simulation) are spawned in the conflict zone(s) and the number of agents in each conflict zone is given.
3) The time period for a conflict situation is assumed to be known.
4) The destination countries are represented by a continuous region.
5) Camp capacity, i.e., the number of people that the camp can support, is limited.
6) Agents move from place to place for each time step, according to predefined rules in [19] (e.g., movement speed is a constant value, and the conflict zones and towns can be visited several times, that is, the returns and circling are allowed during traversing process).
7) The agents stop moving once they arrive at the camp.
3.2 Problem Formulation
1) Notations: The key notations are summarised as follows:
● Set
– : Set of candidate sites, indexed by .
● Parameters
– : Total number of agents in all conflict zones.
– : Number of potential camp sites.
– : Camp capacity (unit: agent).
– : The total number of new camps that will be placed and open.
– : Simulation period or conflict period (unit: day).
– : Site accessibility score at site .
– : Food insecurity score at site .
● Decision variables
– : Index of a candidate site.
● Dependent variables
– : Set of agents in camp at time based on the simulation predictions, indexed by .
– : The distance traveled by an agent in the new camp at the candidate site at time based on the simulation predictions.
– : The number of agents served by the new camp at the candidate site at time based on simulation predictions.
2) Mathematical formulation: The MaOP can be formulated as follows:
subject to
where is known as the decision variable from the feasible region in the decision space , and denotes a five-dimensional objective vector in the objective space .
The first objective function (equation (1)) minimizes individual travel distance. Specifically, the average distance traveled by each arriving agent in a destination camp at the end of the simulation should be minimized. This objective is related to the efficiency of allocating displaced persons to the new camp.
The second objective function (equation (2)) maximizes the number of successful camp arrivals. Specifically, the number of people in the new camp at the end of the simulation should be maximized. This objective function can be easily transformed into a minimization problem by multiplying .
The third objective function (equation (3)) minimizes the amount of idle capacity in the new camp. Specifically, the average value of idle camp capacity over the whole simulation days should be minimized. It should be noted that in this paper we allow more people to enter a camp than its predefined camp capacity. If the idle capacity of the new camp () at specific time is a negative value, we simply take its absolute value.
The fourth objective (equation (4)) minimizes the food insecurity level of a possible site (i.e., ). In other words, we aim to place the camp in a location with maximum food security, so that provisioning food is cheap and easy. We utilize the average food insecurity severity level of a site over a period and prioritize the candidate site with lower severity levels. The lower bound of and the upper bound of .
The fifth objective (equation (5)) maximizes site accessibility (i.e., ). This objective is related to how easily people access the candidate site and how easily humanitarian organizations transfer humanitarian resources to the site. The value of site accessibility is a prioritization score regarding many factors, such as topography, soil and infrastructure. The lower bound of and the upper bound of . A score that is close to one implies easier access (e.g., a site with adequate road infrastructure), whereas a score of zero implies completely unreliable (e.g., wetlands, steep slopes, mountainous areas, narrow valleys and ravines).
Constraint (6) restricts the search space of the MaOP (i.e., a set of possible sites).
Given two solutions of an MaOP, solution is said to Pareto dominate (or simply dominate) solution if there is at least one objective on which is strictly better than and for the other objectives is at least as good as . A solution is said to be Pareto optimal if there is no solution that dominates . All such solutions are called Pareto-optimal (or nondominated) solutions, and these solutions in the objective space constitute the Pareto front of the problem. Considering this MaOP is computationally expensive due to the Flee simulation, we attempt to search for a fixed size of solutions approximating the Pareto front rather than the whole Pareto front.
Note that in this paper we only focus on one camp to be established (i.e., ). We can further extend the MaOP to place multiple new camps, and jointly tackle the problem for all new camps by utilising a set of decision variables (denoted as an -dimensional decision vector , where each decision variable corresponds to a specific new camp). For the extended problem, we will consider all agents who have reached the new camps when calculating the values of the first three objectives.
In addition, the differences between our problem and P-median, P-centre problems, and covering problems are discussed in Sections II and III of the supplementary information.
4. Simulation-based Many-Objective Optimization Approach
We have designed a simulation-optimization framework, which integrates the Flee simulation as well as external data sources into an MaOP. Our framework consists of three stages: (1) optimization, i.e., execution of a many-objective optimization algorithm, (2) simulation, i.e., execution of the Flee simulation using a set of candidate camp locations as input parameters, (3) dataset construction, i.e., collecting food insecurity and accessibility data related to each candidate site.
1) Optimization with evolutionary algorithms: For the optimization part, we employ four representative MOEAs, including a Pareto-based algorithm, i.e., NSGA-II [23], two decomposition-based algorithms, i.e., NSGA-III [29] and MOEA/D [30], and an aggregation-based algorithm, i.e., BCE-MOEA/D [31]. The general process of an MOEA is as follows. To start with, a set of solutions (a population) are randomly generated. Then, a fitness assignment method is employed to sort the population. Each solution is assigned a rank value as its fitness value. Next, a mating selection operation is used to select promising solutions as parents, followed by variation operations to create offspring. Finally, the environmental selection is applied to preserve best solutions from the combined population (i.e., the current population and its offspring) as the next-generation population. This evolutionary process continues until a stopping criterion (e.g., the maximum generations) is met. For an MOEA, two important components, i.e., the representation of a candidate solution and the calculation of objective values, are described as follows.
A candidate solution of the MaOP is represented as a chromosome on the basis of a grid-based spatial representation strategy. Specifically, the entire study area is divided into a number of fine spatial grids as shown in Figure 2. Each grid in the neighboring countries (blue areas) represents a unit for establishing new camp(s), and the total number of possible sites is the number of grids in the blue area. The spatial location of each grid cell is denoted as a pair of longitude and latitude coordinates corresponding to its centroid. Given a set of all possible locations, the chromosome is sequentially encoded by the index(es) of selected location(s). It should be noted that in this paper, we consider the MaOP with one new camp to be set up (i.e., ). In addition, we reduce the search space by removing two types of unsuitable locations from the location set, which include those locations with a slope above 10% and those locations covered by water throughout the year in the form of rivers, lakes or oceans.
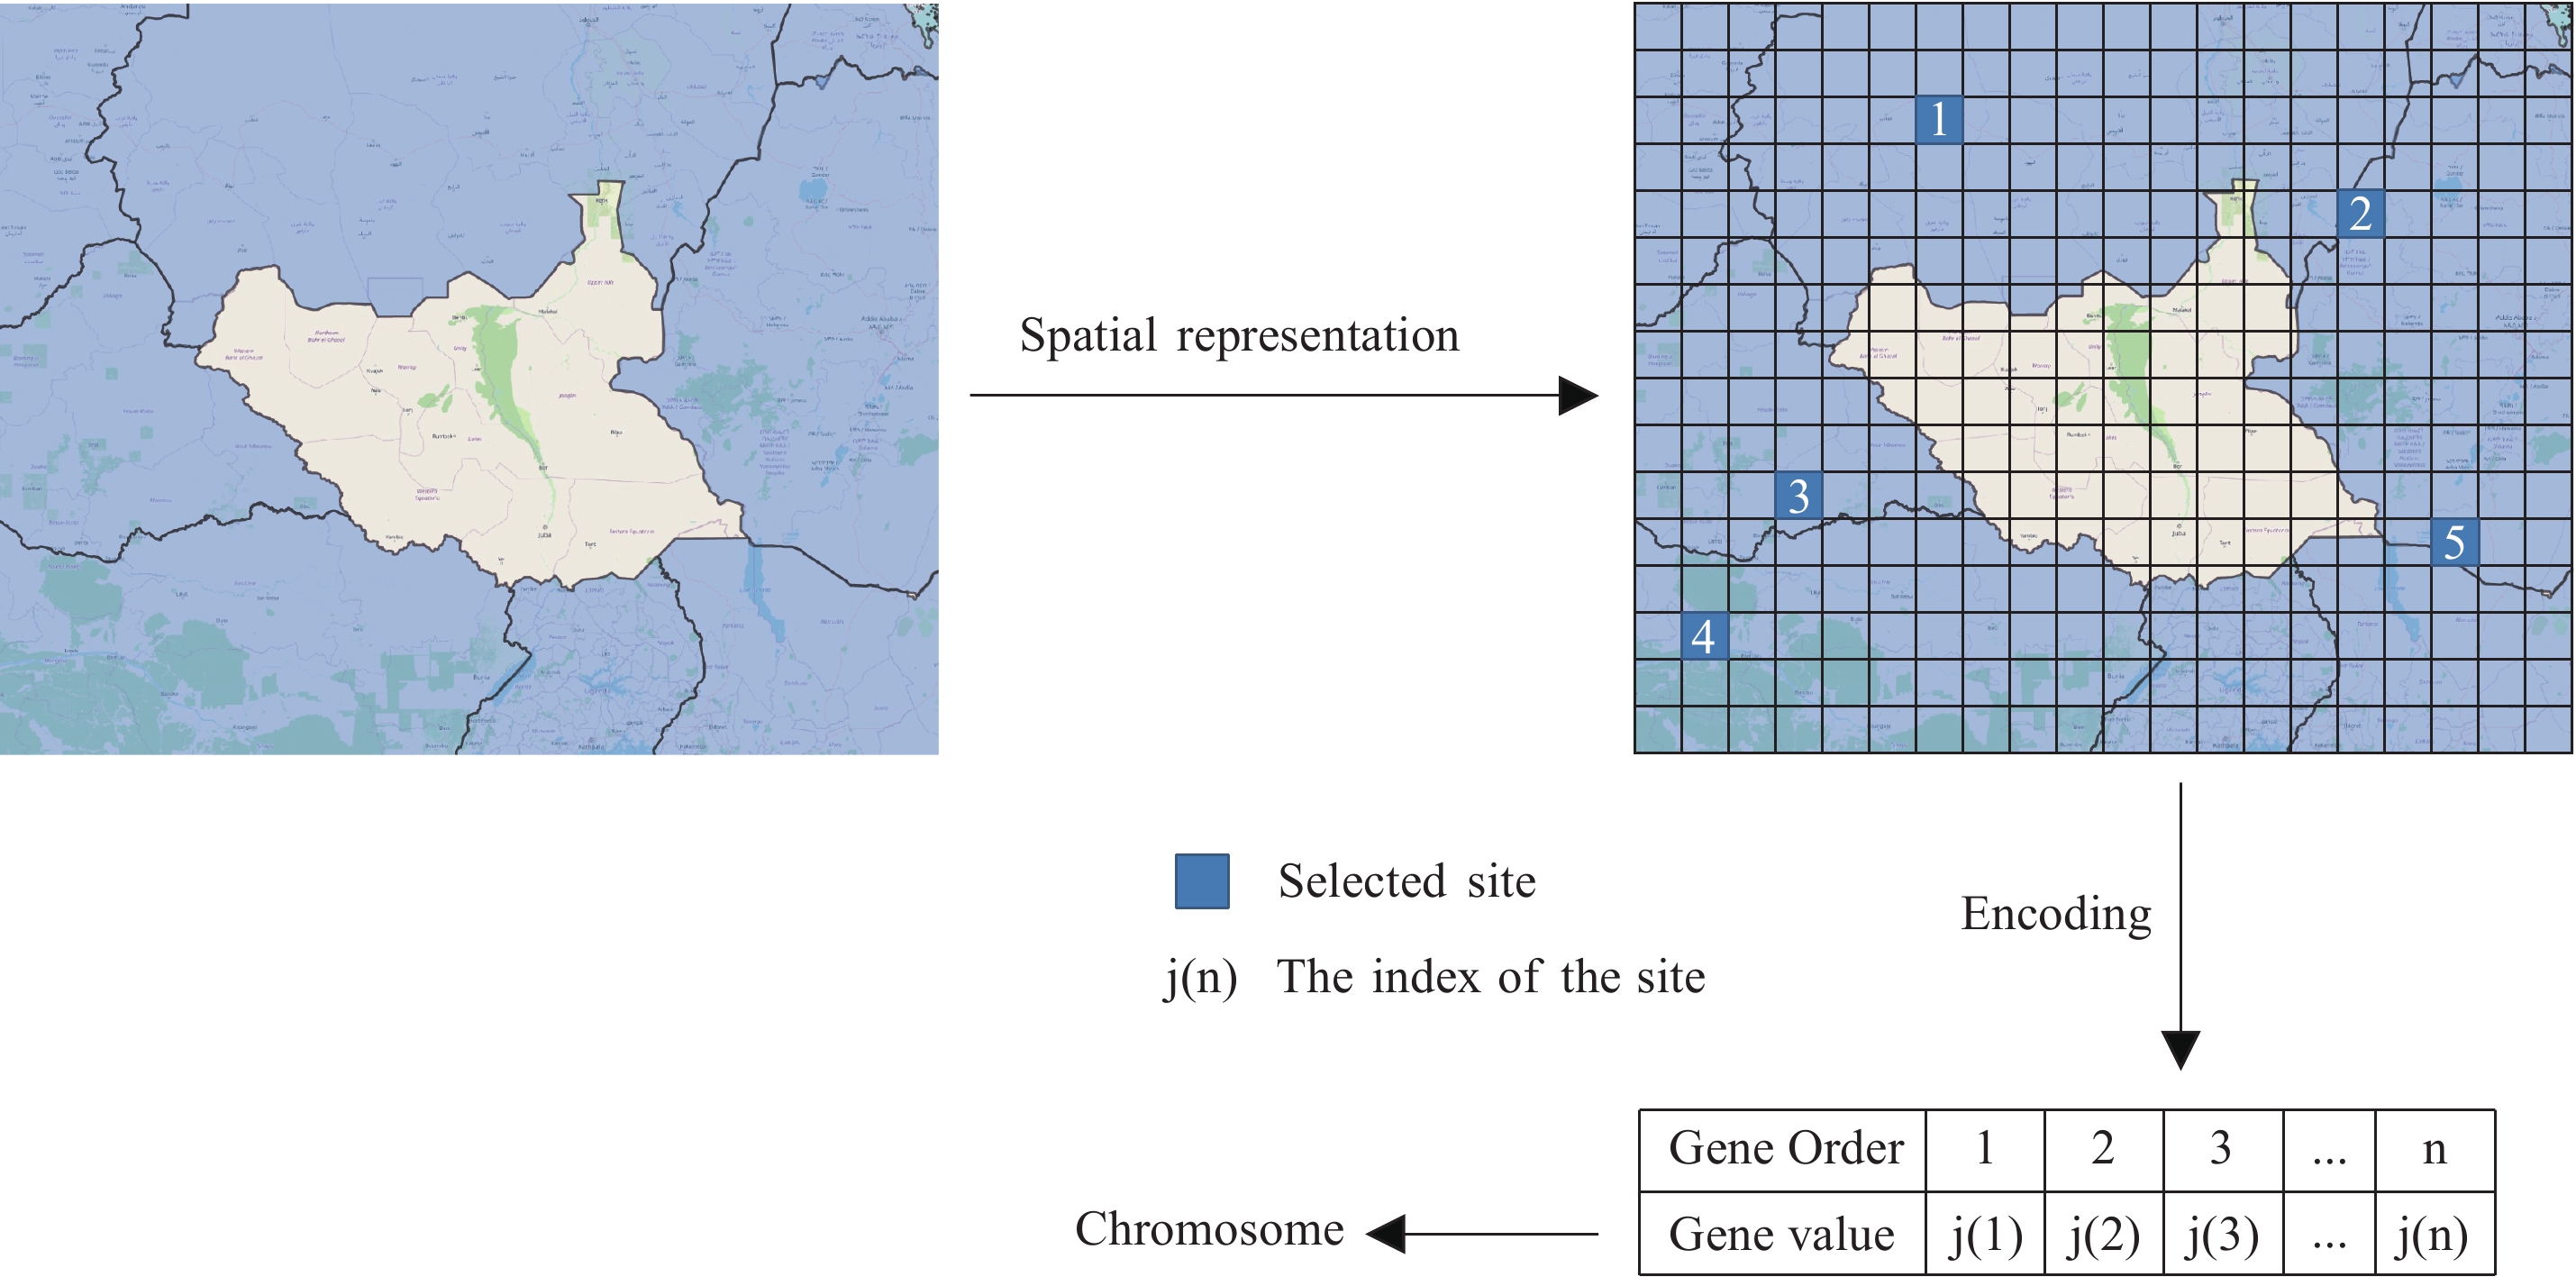
Figure 2. Spatial representation and encoding strategy developed for MOEAs.
The objective calculation consists of two parts. For objectives related to the movements of forced displaced persons (equations (1)–(3)), the objective values for each candidate solution in the current population (a solution set) are derived from the Flee simulation. The Flee simulation takes the (camp) coordinates, which correspond to each candidate solution, as input parameters, and then assesses and outputs the values of the first three objectives for each candidate solution. For the objective with respect to food insecurity (equation (4)) and the objective related to site accessibility (equation (5)), the objective values are derived based on open sources.
2) Migration simulation with Flee: Since the FLP in forced migration involves uncertainty in demand (i.e., the number of people in need), it is difficult to directly solve our mathematical model without any explicit equations of these objectives in equations (1)–(3). Therefore, we evaluate those objectives related to people's movement (i.e., individual travel distance, the number of successful camp arrivals, and average idle capacity over the simulation period) based on the Flee simulation [19].
The Flee simulation code () is used to forecast the number of arriving agents at a candidate camp, given a particular conflict instance. According to [19], to start with, agents (i.e., forcibly displaced people) are spawned in the conflict zone(s). Then, agents move from place to place for each time step (i.e., one day), according to predefined rules. These rulesets can be roughly divided into two parts. The first rule (known as move chance) is concerned with the probability of traversing a link with a maximum speed defined by max_move_speed (e.g., km per day). For example, the parameter camp_move_chance is the probability of an agent in the camp moving to another location. The second rule (known as path selection) determines how to choose one path among all available direct paths between the current place where an agent is located and another place. Path selection is based on the attractiveness of different types of destinations and the length of the link in kilometers. Finally, the simulation terminates after time steps.
To automate the process, we rely on FabFlee (Fabric for Flee Simulation) plugin (https://github.com/djgroen/FabFlee), an integration of the Flee simulation code and the FabSim3 [32] toolkit (https://github.com/djgroen/FabSim3). FebFlee provides an environment to construct and modify migration simulations, and execute an ensemble of Flee jobs or migration simulations. Each migration simulation is different with a set of different parameters [33].
Since there is commonly large-scale data (affected people) in the context of forced migration, it is very computationally expensive to execute a simulation for a group of camp locations. To decrease the runtime, we employ the QCG-PilotJob (http://github.com/vecma-project/QCG-PilotJob) for scheduling the ensemble runs that have been submitted. QCG-PilotJob is based on the idea of Pilot Job, which manages a large number of relatively short tasks and ensures that tasks are scheduled efficiently on HPC machines [34].
3) Dataset construction: The food insecurity data is derived from the Integrated Food Security Phase Classification (IPC) website (). Specifically, the food insecurity severity level of a candidate site is the average IPC phase score (ranging from to ) of the site over a period of time. In the data preparation, we handle missing values according to a priority list (more details about the priority list and heuristics used for each priority can be found in Supplementary Data 1).
Accessibility data is concerned with the terrain and land cover factors of a group of potential sites. For terrain, we extract data from the JAXA ALOS Global 30m DSM 2021 dataset downloaded from . This dataset, derived from the Japanese space agency’s ALOS global digital surface model, is a global digital elevation dataset with a horizontal resolution of approximately meters. We derive the slope (or the degree of incline between different elevations) from this elevation dataset in the Google Earth Engine (GEE). Then, we reclassify the slope data into two classes, i.e., the area where the slope is below and the area where the slope is above . Finally, following UNHCR Principles & Standards for Settlement Planning (), we remove those possible camp locations if their slopes are above ten percentages considering the drainage factor as well as the costs of roads and building construction.
For land cover, we rely on the Esri Land Cover 2020 source downloaded from . This dataset consists of ten classes of land cover data 2020 (Water, Trees, Grass, Flooded vegetation, Crops, Scrub/shrub, Built area, Bare ground, Snow/Ice, and Clouds), and is derived from Sentinel-2 imagery at 10-meter resolution. From this dataset, we derive land cover data of all potential camp locations and then reclassify them according to the suitability of the place for establishing a new camp. Given being completely suited and being completely unsuited, three classes including Flooded vegetation, Snow/Ice, and Clouds are assigned the value of , four classes including Trees, Crops, Built area, and Bare ground are assigned the value of , The Scrub/shrub is assigned , and the Grass class is assigned . In particular, the data that falls into the class Water is excluded since it is not realistic to place a camp in a lake or a river. In summary, the accessibility scores of potential camp locations range from to , and a higher value is preferred.
5. Results
5.1 Case Study: South Sudan
As a case study, we apply the MaOP to a real-world conflict situation in South Sudan. Using the Flee [17] simulation, we investigate the conflict period from 15th December to 10th August 2015. This simulation setting is fully presented in [33], but in short it contains up to million agents over a simulation period of days, conflict zones and towns within South Sudan, as well as ten camps in the neighboring countries (Sudan, Uganda, and Ethiopia). Within the spatial simulation domain we consider possible refugee camp locations outside of South Sudan in a region with the geographic coordinates and . We extract a total of (approximately 11 km × 11 km) grid cells, which constitute the feasible search space for EAs. In addition, we modify the model refinement phase [33] so as to integrate the simulation process into multiobjective evolutionary algorithms (see Section I of the supplementary information for more details).
5.2 Test Problems
To investigate the quality of solutions in a range of different settings, four test problems are designed based on the South Sudan conflict model ssudan_ccamp in [33]:
● MCLP-SS1: a many-objective camp location problem for the South Sudan conflict model ssudan_ccamp, where (i) no refugee camp in neighboring countries is considered and (ii) the ‘haversine’ formula is employed for calculating the distance between a refugee camp and its nearest location in South Sudan.
● MCLP-SS2: a many-objective camp location problem for the South Sudan conflict model ssudan_ccamp, where (i) ten refugee camps in neighboring countries are considered and (ii) the ‘haversine’ formula is employed for calculating the distance between a refugee camp and its nearest location in South Sudan.
● MCLP-SS3: a many-objective camp location problem for the South Sudan conflict model ssudan_ccamp, where (i) no refugee camp in neighboring countries is considered and (ii) the route planning method in [35] is employed for calculating the distance between a refugee camp and its nearest location in South Sudan.
● MCLP-SS4: a many-objective camp location problem for the South Sudan conflict model ssudan_ccamp, where (i) ten refugee camps in neighboring countries are considered and (ii) the route planning method in [35] is employed for calculating the distance between a refugee camp and its nearest location in South Sudan.
5.3 Parameter Settings
For the four test problems, we set a value of for the probability of agents moving from camps to another location (simulation parameter CampMoveChance) indicating that asylum-seekers/unrecognized refugees stop moving once they reach a camp. Other important simulation parameter settings include the maximum distance covered by agents per day (MaxMoveSpeed, being set to km/day) and the setting that agents are aware of the state of their current and adjacent locations (AwarenessLevel).
In particular, we set the capacity of the new camp to (i.e., ) for MCLP-SS1 and MCLP-SS3, and () for MCLP-SS2 and MCLP-SS4. Because our experiments involve running thousands of simulations, we scale down the number of agents from all conflict zones by a factor , and scale down camp capacity and the number of people in a town or a conflict zone accordingly. This is known to proportionally reduce the execution time despite a larger aleatoric uncertainty.
To make fair comparisons of the selected optimization algorithms including four MOEAs (i.e., NSGA-II, reference-point based NSGA-II (NSGA-III) [29], multiobjective EA based on decomposition (MOEA/D) [30], and bi-criterion evolution embedded with MOEA/D (BCE-MOEA/D) [31]) and the Random Search algorithm, we adopt the following parameter settings.
● The population size (i.e., the number of a set of solutions) for all four MOEAs is set to for all test problems.
● For all MOEAs, the stopping criterion of one run is set to generations for each test problem.
● The four MOEAs employ two variation operators, i.e., the simulated binary crossover [36] and polynomial mutation [37]. For the simulated binary crossover, its distribution index is set to and the crossover probability is set to . For the mutation operator, its distribution index is set to and mutation probability is set to .
● The Random Search algorithm, which is a benchmark method for comparison against all the other four algorithms, randomly generates candidate solutions.
5.4 Performance Indicators
We assess the performance of all tested algorithms using the following three indicators:
Hypervolume (HV), which is one of the most commonly used performance indicators in the area of evolutionary multiobjective optimization (EMO). Compared with most of the performance indicators in the EMO area, there is no requirement for the problem's Pareto front to be known when calculating HV, thus making HV well-suited for practical MaOPs. HV evaluates the performance of a solution set obtained by an algorithm in terms of four quality aspects, which include convergence, spread, uniformity and cardinality. Given a solution set and a reference point , , , in the objective space, HV is defined as follows [38]:
where represents the Lebesgue measure, , , , denotes an objective vector in , and stands for the number of objectives. For HV, a larger value indicates better overall quality of the solution set. The calculation of HV needs to tackle two issues well, i.e., the scaling of the objective space and the setting of the reference point. Following the suggestions in [39], each objective value of obtained solutions is normalized based on the range of an approximate Pareto front. The approximate Pareto front are a set of nondominated solutions, which are selected from the combination of all the solution sets generated by all peer algorithms. Moreover, the reference point is set to , , , , namely times of the nadir point.
Unique nondominated front ratio (UNFR), which is a cardinality-based indicator [40] suitable for practical combinatorial MaOPs. UNFR compares nondominated solutions in the obtained solution set to the Pareto front of the problem, and only considers unique nondominated solutions that are not dominated by any other solution sets. Specifically, for an algorithm, UNFR returns the ratio of the number of unique nondominated solutions in the solution set to the size of the reference set. A higher UNFR value is preferred. As the true Pareto front of many-objective camp location problem is unknown, the reference set is constituted by those unique nondominated solutions in the combination of all the solution sets generated by all peer algorithms.
The indicator (coverage of two sets) [38], which is used for relative convergence comparison of two solution sets based on the Pareto dominance relation. Let and be two solution sets, a solution is said to cover or weakly dominate solution if is not worse than on any objective. The function calculates the proportion of the solutions of that are covered by at least one solution of set . The value denotes that none of the solutions in set is covered by any solution of set , and means that all solutions in set are covered by solutions in set . Note that both and need to be considered when comparing two solution sets, since they are not necessarily equal, for example, if dominates (i.e., every solution of dominates at least one solution of ), then and . In addition, unless there are no solutions in two sets that are nondominated to each other. Moreover, following the suggestions in [39], we remove the duplicate solutions and then calculate the values of two solution sets.
Note that the quality of a solution set obtained by an MOEA may degenerate during the evolutionary process. A recent study demonstrated that such algorithms may face the challenge of maintaining the diversity of solutions [41]. Therefore, to make a fair comparison between those MOEAs and the Random Search, in this paper, we use all nondominated solutions found in all generations as the output of an algorithm.
5.5 Performance Comparison
The solution sets of peer algorithms on four test problems are given in Supplementary Tables 1–20. Table 1 gives the quality of solution sets obtained by the selected algorithms on four test problems, in terms of HV and UNFR values. For each test problem, the best result is highlighted in boldface. Furthermore, the HV results computed on the final solution sets (i.e., the solution sets generated in the last generation) of all algorithms are shown in Supplementary Table 21.
| Problem | Indicator | NSGA-II | NSGA-III | MOEA/D | BCE-MOEA/D | Random Search |
| MCLP-SS1 | HV | 0.5003 | 0.4657 | 0.4522 | 0.4599 | 0.3051 |
| UNFR | 0.2143 | 0.2424 | 0.5200 | 0.2571 | 0.1613 | |
| MCLP-SS2 | HV | 0.6783 | 0.7024 | 0.7118 | 0.7206 | 0.6404 |
| UNFR | 0.3933 | 0.5114 | 0.4292 | 0.4421 | 0.3299 | |
| MCLP-SS3 | HV | 0.3965 | 0.5634 | 0.4194 | 0.4073 | 0.3813 |
| UNFR | 0.3200 | 0.5517 | 0.4375 | 0.4242 | 0.0769 | |
| MCLP-SS4 | HV | 0.4604 | 0.5124 | 0.4995 | 0.4716 | 0.5095 |
| UNFR | 0.3451 | 0.4107 | 0.4510 | 0.4436 | 0.2386 |
As can be seen in Table 1, for HV, NSGA-III obtains the best performance on MCLP-SS3 and MCLP-SS4. The performance of NSGA-II is superior to other algorithms on MCLP-SS1, but is inferior to other MOEAs on the remaining test problems. BCE-MOEA/D performs better than other algorithms on MCLP-SS2. MOEA/D achieves the second best results on three test problems. Random Search has the lowest HV values on three test problems, except for MCLP-SS4.
For UNFR, NSGA-III is the peer algorithm with the highest (best) values ( and ) on MCLP-SS2 and MCLP-SS3, while MOEA/D is the peer algorithm with the highest values ( and ) on MCLP-SS1 and MCLP-SS4. NSGA-II performs worse than the other three MOEAs on the four test problems. BCE-MOEA/D performs the second best on three test problems (MCLP-SS1, MCLP-SS2 and MCLP-SS4). For Random Search, it achieves the lowest (worst) values among the five algorithms, with a maximum value around .
To evaluate the quality of solutions in terms of convergence, Table 2 presents the comparison of different algorithms based on the indicator (coverage of two sets), where , , , , and represent the solution sets of NSGA-II, NSGA-III, MOEA/D, BCE-MOEA/D and Random Search, respectively. As can be seen, the solution sets of these MOEAs cover (weakly dominate) the majority of the solutions obtained by Random Search on three test problems (i.e., MCLP-SS1, MCLP-SS3, and MCLP-SS4). For the remaining test problem (i.e., MCLP-SS2), the five algorithms perform similarly in terms of convergence, since none of them obtains a solution set that covers over half of the solution set of the other algorithm.
| Coverage | Test Problem | Mean | |||
| MCLP-SS1 | MCLP-SS2 | MCLP-SS3 | MCLP-SS4 | ||
| (,) | 39.39% | 18.75% | 20.69% | 31.25% | 27.52% |
| (,) | 32.00% | 22.64% | 28.13% | 34.64% | 29.35% |
| (,) | 34.29% | 16.31% | 24.24% | 30.08% | 26.23% |
| (,) | 67.74% | 32.99% | 57.69% | 53.41% | 52.96% |
| (,) | 32.14% | 33.71% | 56.00% | 40.71% | 40.64% |
| (,) | 32.00% | 33.49% | 34.38% | 30.72% | 32.65% |
| (,) | 17.14% | 30.90% | 27.27% | 37.59% | 28.23% |
| (,) | 67.74% | 40.21% | 61.54% | 60.23% | 57.43% |
| (,) | 46.43% | 32.58% | 44.00% | 38.05% | 40.27% |
| (,) | 66.67% | 26.70% | 27.59% | 32.14% | 38.28% |
| (,) | 45.71% | 36.48% | 27.27% | 27.82% | 34.32% |
| (,) | 61.29% | 41.24% | 46.15% | 52.27% | 50.24% |
| (,) | 39.29% | 40.45% | 56.00% | 35.40% | 42.78% |
| (,) | 39.39% | 32.95% | 31.03% | 40.18% | 35.89% |
| (,) | 32.00% | 34.91% | 34.38% | 30.07% | 32.84% |
| (,) | 77.42% | 48.45% | 65.38% | 60.23% | 62.87% |
| (,) | 21.43% | 13.48% | 48.00% | 16.81% | 24.93% |
| (,) | 21.21% | 9.66% | 6.90% | 15.18% | 13.24% |
| (,) | 20.00% | 13.68% | 28.13% | 12.42% | 18.56% |
| (,) | 14.29% | 6.87% | 18.18% | 11.28% | 12.65% |
Among these MOEAs, both NSGA-III and BCE-MOEA/D outperform NSGA-II on MCLP-SS3, with solutions of NSGA-II being covered by the solutions obtained by the two algorithms. Moreover, MOEA/D outperforms NSGA-III on MCLP-SS1, with coverage of the solution set obtained by NSGA-III.
To intuitively describe the distribution of the solutions in the high-dimensional objective space, Figure 3 plots, by parallel coordinates, the solutions obtained by BCE-MOEA/D and Random Search on MCLP-SS2. As a popular tool for visualizing high-dimensional data, the parallel coordinates transform the original multi-dimensional data to a two-dimensional parallel coordinates plane. Recently, Li et al. [42] have systematically described how to use the parallel coordinates plot to present a many-objective solution set, and they have indicated that the parallel coordinates representation can partly reflect the quality of a solution set, e.g., convergence, spread, and uniformity. Note that the objective values of the solution set obtained by an algorithm for a test problem are normalized according to the maximum and minimum values of each objective of an approximate Pareto front of the test problem. The approximate Pareto front of a test problem consists of all nondominated solutions regarding the combined set of all solution sets obtained by all algorithms on the test problem.

Figure 3. The nondominated solutions obtained by BCE-MOEA/D (HV = 0.7206) and Random Search (HV = 0.6404) on MCLP-SS2, as shown by parallel coordinates.
As shown in Figure 3, BCE-MOEA/D and Random Search perform similarly regarding the convergence, with both of their solution sets being located in the range of the approximate Pareto front ([, ]), but they perform differently in terms of diversity. In contrast with Random Search that fails to cover the range between and on the second objective as well as the range between and on the third objective, BCE-MOEA/D has a better distributed solution set that covers the range within and on the second and third objectives, respectively. It seems that the solutions obtained by Random Search mainly concentrate in some areas of the approximate Pareto front since there are few lines distributed around the middle part on the first three objectives, while the solutions obtained by BCE-MOEA/D distribute uniformly on the second and third objectives. As a result, BCE-MOEA/D has a better HV value than Random Search (shown in the figure).
To intuitively describe the distribution of the solutions in the decision space, Figure 4 plots the suggested refugee camp locations obtained by the five algorithms on four test problems. Note that these refugee camp locations obtained by an algorithm correspond to the unique nondominated solutions in the solution set when calculating UNFR of the algorithm. As can be seen, the refugee camp locations obtained by NSGA-II, NSGA-III, and BCE-MOEA/D are widely distributed for most of the test problems. The refugee camp locations obtained by MOEA/D are mainly crowded or even overlapping in those areas close to the boundary between South Sudan and its neighboring countries for MCLP-SS2, MCLP-SS3, and MCLP-SS4. For Random Search, it provides much fewer refugee camp locations than its peer algorithms on all the test problems. In particular, Random Search only obtains two refugee camp locations for MCLP-SS3, which are near the boundary between South Sudan and its neighboring countries.
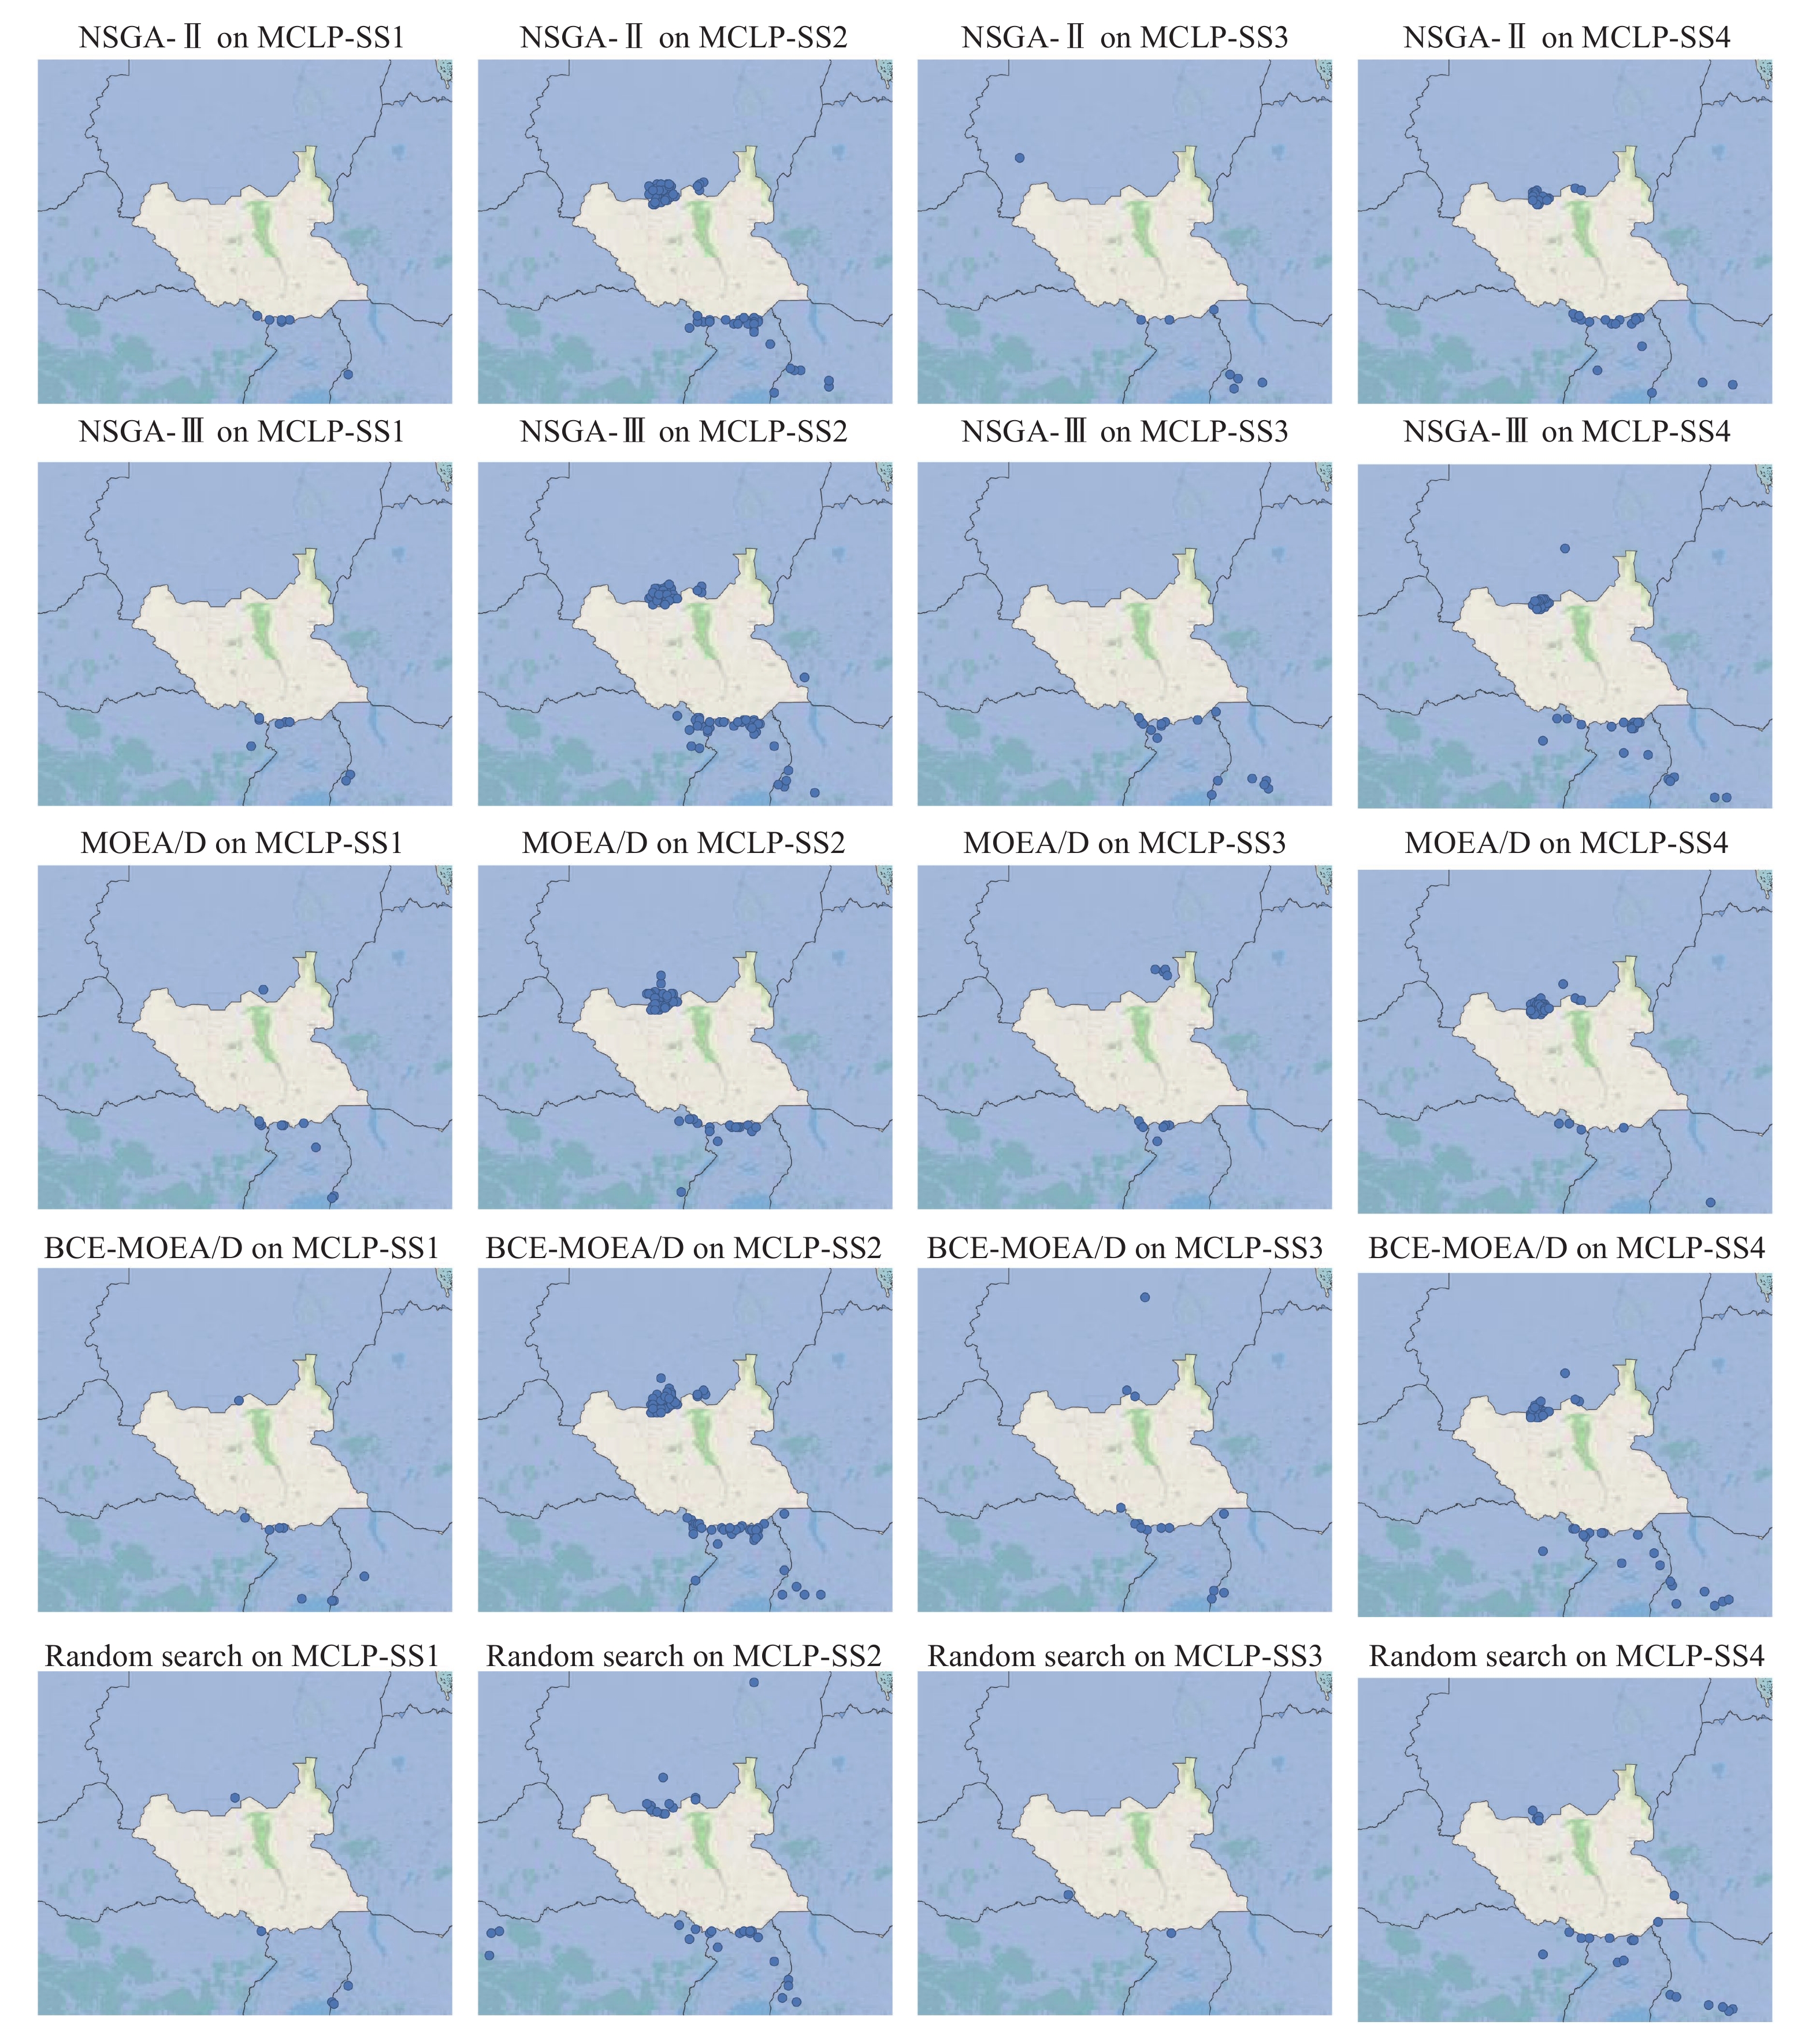
Figure 4. Suggested refugee camp locations (blue circles) obtained by five algorithms (NSGA-II, NSGA-III, MOEA/D, BCE-MOEA/D, and Random Search) on MCLP-SS1, MCLP-SS2, MCLP-SS3, and MCLP-SS4.
5.6. Discussion
We have evaluated the performance of our approach across four multiobjective evolutionary algorithms (MOEAs), and compared the performance with a more primitive baseline technique (Random Search). Based on our findings regarding the HV, UNRF, and indicators of the solution sets, we conclude that the selected MOEAs find a much wider range of high-quality solutions than Random Search. The failure of Random Search may be explained by its lack of a mechanism to balance the convergence and diversity during the search process. The advantages of the selected MOEAs are that they adopt different methods to search for global optima. For instance, NSGA-II employs a nondominated sorting method and the crowding distance method to estimate the convergence and the density of a solution, respectively. NSGA-III also adopts the nondominated sorting method for the convergence estimation and it introduces a niche-preservation operation for diversity maintenance. MOEA/D uses a set of predefined weight vectors to preserve diversity, and an aggregation approach to facilitate convergence. BCE-MOEA/D designs a bi-criterion evolution (BCE) framework, where its two components Pareto criterion (PC) evolution and non-Pareto criterion (NPC) evolution work collaboratively to drive the solutions towards the Pareto front without diversity loss during the evolutionary process.
Among the selected MOEAs, regarding , our experiments show that the selected MOEAs obtain similar convergence as there is no one MOEA that systematically outperforms all others (see Table 2). Nevertheless, there are differences concerning the HV and UNFR indicators. NSGA-III seems to be the best algorithm for the FLP, which can search for a set of high-quality solutions in terms of HV and UNFR on half of the test problems. The solution sets of MOEA/D also obtain good overall quality (with the second best HV values on three test problems) and the largest cardinality on two test problems, while BCE-MOEA/D shows the best overall performance (in terms of HV) on one test problem and the second best performance regarding cardinality on three test problems.
NSGA-II performs worse than the other selected MOEAs on the test problems. Although NSGA-II achieves the best HV value on one test problem, it obtains the worst HV values on the remaining test problems. Moreover, it performs the worst among these MOEAs in terms of UNFR on all test problems. The reason for the poor performance of NSGA-II may be that this algorithm, as a well-known Pareto-based algorithm, is originally designed for solving two- or three-objective optimization problems and its performance could deteriorate when tackling optimization problems with four or more objectives.
6. Conclusion
In this work, we have presented and assessed a new approach to automatically find suitable locations for refugee camp construction. To the best of our knowledge, this paper is the first to develop a many-objective optimization approach to handle the FLP in the context of humanitarian support for forcibly displaced people. Our approach is unique in that it is able to balance up to five different objectives, and that it can incorporate objectives from existing data sources as well as from a migration forecasting model (Flee). We have addressed the underlying many-objective optimization problem (MaOP) using a simulation-optimization approach, where the (Flee) simulation captures the movement of each person. Our proposed simulation-optimization approach provides a general framework that can be embedded by various MOEAs, and our case study in South Sudan has demonstrated its applicability in a real-world scenario. Our experimental results show that our approach can provide a set of diverse and high-quality location suggestions for decision-makers, where each suggested solution represents a different trade-off among the introduced five objectives. In the future, we aim to: 1) explore the possibility of integrating other optimization algorithms (e.g., the PSO algorithm [43, 44], the differential evolution algorithm [45], and the simulated annealing algorithm [46]) in the proposed approach; 2) apply the proposed approach to other conflict scenarios; 3) improve the proposed approach by considering various objectives such as construction and transportation costs; and 4) extend the proposed approach to multiple refugee camp location optimization problems. Overall, based on the results of our approach, we believe that research that combines artificial intelligence techniques with migration simulations can provide ways to support a broad range of important humanitarian decisions.
Author Contributions: Yani Xue: conceptualization, methodology, software, formal analysis, investigation, visualization, writing - original draft; Miqing Li: conceptualization, methodology, formal analysis, writing - review & editing; Hamid Arabnejad, Diana Suleimenova, Alireza Jahani, Bernhard C. Geiger, Freek Boesjes: conceptualization, software, writing - review & editing; Anastasia Anagnostou, Simon J.E. Taylor: conceptualization, methodology, writing - review & editing; Xiaohui Liu: supervision, conceptualization, methodology, writing - review & editing; Derek Groen: project administration, funding acquisition, conceptualization, methodology, formal analysis, writing - review & editing. All authors have read and agreed to the published version of the manuscript.
Funding: This work was supported by the ITFLOWS and HiDALGO projects, which have received funding from the European Union Horizon 2020 research and innovation programme under grant agreement nos 882986 and 824115. It was also supported by UKRI through the ExCALIBUR-funded SEAVEA project initiative (grant agreement number EP/W007762/1).
Data Availability Statement: The Integrated Food Security Phase Classification (IPC) datasets can be downloaded from: https://www.ipcinfo.org/ipc-country-analysis/, the JAXA ALOS Global 30m DSM 2021 dataset can be downloaded from https://developers.google.com/earth-engine/datasets/catalog/JAXA_ALOS_AW3D30_V3_2, the Esri Land Cover 2020 source can be downloaded from https://www.arcgis.com/apps/instant/media/index.html?appid=fc92d38533d440078f17678ebc20e8e2.
Conflicts of Interest: The authors declare no competing interest.
Acknowledgments: The authors are grateful to Save the Children International, in particular, Alan Paul for the constructive discussion on this work.

References
- UNHCR. “Figures at a glance 2023,” United Nations High Commissioner for Refugees. 2024. Available online: https://www.unhcr.org/about-unhcr/who-we-are/figures-glance.
- Estrada, L. E. P.; Groen, D.; Ramirez-Marquez, J. E. A serious video game to support decision making on refugee aid deployment policy. Procedia Comput. Sci., 2017, 108: 205−214. doi: 10.1016/j.procs.2017.05.112
- Ghasemi, P.; Khalili-Damghani, K.; Hafezalkotob, A.; et al. Uncertain multi-objective multi-commodity multi-period multi-vehicle location-allocation model for earthquake evacuation planning. Appl. Math. Comput., 2019, 350: 105−132. doi: 10.1016/j.amc.2018.12.061
- Rawls, C. G.; Turnquist, M. A. Pre-positioning and dynamic delivery planning for short-term response following a natural disaster. Socio-Econ. Plan. Sci., 2012, 46: 46−54. doi: 10.1016/j.seps.2011.10.002
- Chanta, S.; Sangsawang, O. Shelter-site selection during flood disaster. Lecture Notes Manage. Sci., 2012, 4: 282−288
- Liu, K. L.; Liu, C. C.; Xiang, X.; et al. Testing facility location and dynamic capacity planning for pandemics with demand uncertainty. Eur. J. Oper. Res., 2023, 304: 150−168. doi: 10.1016/j.ejor.2021.11.028
- Devi, Y.; Patra, S.; Singh, S. P. A location-allocation model for influenza pandemic outbreaks: A case study in India. Oper. Manage. Res., 2022, 15: 487−502. doi: 10.1007/s12063-021-00216-w
- Cilali, B.; Barker, K.; González, A. D. A location optimization approach to refugee resettlement decision-making. Sustain. Cities Soc., 2021, 74: 103153. doi: 10.1016/j.scs.2021.103153
- Barzinpour, F.; Esmaeili, V. A multi-objective relief chain location distribution model for urban disaster management. Int. J. Adv. Manuf. Technol., 2014, 70: 1291−1302. doi: 10.1007/s00170-013-5379-x
- Zhao, X. G.; Liang, J.; Meng, J.; et al. An improved quantum particle swarm optimization algorithm for environmental economic dispatch. Expert Syst. Appl., 2020, 152: 113370. doi: 10.1016/j.eswa.2020.113370
- Xue, Y. N.; Li, M. Q.; Shepperd, M.; et al. A novel aggregation-based dominance for Pareto-based evolutionary algorithms to configure software product lines. Neurocomputing, 2019, 364: 32−48. doi: 10.1016/j.neucom.2019.06.075
- Liu, W. B.; Wang, Z. D.; Liu, X. H.; et al. A novel particle swarm optimization approach for patient clustering from emergency departments. IEEE Trans. Evol. Comput., 2019, 23: 632−644. doi: 10.1109/TEVC.2018.2878536
- Pramanik, R.; Sarkar, S.; Sarkar, R. An adaptive and altruistic PSO-based deep feature selection method for Pneumonia detection from Chest X-rays. Appl. Soft Comput., 2022, 128: 109464. doi: 10.1016/j.asoc.2022.109464
- Motaghedi-Larijani, A. Solving the number of cross-dock open doors optimization problem by combination of NSGA-II and multi-objective simulated annealing. Appl. Soft Comput., 2022, 128: 109448. doi: 10.1016/j.asoc.2022.109448
- Mendonça, G. H. M.; Ferreira, F. G. D. C.; Cardoso, R. T. N.; et al. Multi-attribute decision making applied to financial portfolio optimization problem. Expert Syst. Appl., 2020, 158: 113527. doi: 10.1016/j.eswa.2020.113527
- Zhao, M.; Chen, Q. W.; Ma, J.; et al. Optimizing temporary rescue facility locations for large-scale urban environmental emergencies to improve public safety. J. Environ. Inf., 2017, 29: 61−73. doi: 10.3808/jei.201600340
- Groen, D. Simulating refugee movements: Where would you go?. Procedia Comput. Sci., 2016, 80: 2251−2255. doi: 10.1016/j.procs.2016.05.400
- Chen, T.; Li, M. Q. The weights can be harmful: Pareto search versus weighted search in multi-objective search-based software engineering. ACM Trans. Software Eng. Methodol., 2023, 32: 5. doi: 10.1145/3514233
- Suleimenova, D.; Bell, D.; Groen, D. A generalized simulation development approach for predicting refugee destinations. Sci. Rep., 2017, 7: 13377. doi: 10.1038/s41598-017-13828-9
- Manopiniwes, W.; Irohara, T. Stochastic optimisation model for integrated decisions on relief supply chains: Preparedness for disaster response. Int. J. Prod. Res., 2017, 55: 979−996. doi: 10.1080/00207543.2016.1211340
- Hallak, J.; Koyuncu, M.; Miç, P. Determining shelter locations in conflict areas by multiobjective modeling: A case study in northern Syria. Int. J. Disaster Risk Reduct., 2019, 38: 101202. doi: 10.1016/j.ijdrr.2019.101202
- Atta, S.; Mahapatra, P. R. S.; Mukhopadhyay, A. A multi-objective formulation of maximal covering location problem with customers’ preferences: Exploring Pareto optimality-based solutions. Expert Syst. Appl., 2021, 186: 115830. doi: 10.1016/j.eswa.2021.115830
- Deb, K.; Pratap, A.; Agarwal, S.; et al. A fast and elitist multiobjective genetic algorithm: NSGA-II. IEEE Trans. Evol. Comput., 2002, 6: 182−197. doi: 10.1109/4235.996017
- Wang, C.; Wang, Z. Q.; Tian, Y.; et al. A dual-population based evolutionary algorithm for multi-objective location problem under uncertainty of facilities. IEEE Trans. Intell. Transp. Syst., 2022, 23: 7692−7707. doi: 10.1109/TITS.2021.3071786
- Wang, J.; Shen, D. Q.; Yu, M. Z. Multiobjective optimization on hierarchical refugee evacuation and resource allocation for disaster management. Math. Probl. Eng., 2020, 2020: 8395714. doi: 10.1155/2020/8395714
- Boonmee, C.; Arimura, M.; Asada, T. Facility location optimization model for emergency humanitarian logistics. Int. J. Disaster Risk Reduct., 2017, 24: 485−498. doi: 10.1016/j.ijdrr.2017.01.017
- Hunter, S. R.; Applegate, E. A.; Arora, V.; et al. An introduction to multiobjective simulation optimization. ACM Trans. Model. Comput. Simul., 2019, 29: 7. doi: 10.1145/3299872
- Xue, Y. N.; Li, M. Q.; Arabnejad, H.;
et al . Camp location selection in humanitarian logistics: A multiobjective simulation optimization approach. InProceedings of the 22nd International Conference on Computational Science ,London ,UK ,21-23 June 2022 ; Springer: Berlin/Heidelberg, Germany, 2022; pp. 497–504. doi: 10.1007/978-3-031-08757-8_42 - Deb, K.; Jain, H. An evolutionary many-objective optimization algorithm using reference-point-based nondominated sorting approach, Part I: Solving problems with box constraints. IEEE Trans. Evol. Comput., 2014, 18: 577−601. doi: 10.1109/TEVC.2013.2281535
- Zhang, Q. F.; Li, H. MOEA/D: A multiobjective evolutionary algorithm based on decomposition. IEEE Trans. Evol. Comput., 2007, 11: 712−731. doi: 10.1109/TEVC.2007.892759
- Li, M. Q.; Yang, S. X.; Liu, X. H. Pareto or non-Pareto: Bi-criterion evolution in multiobjective optimization. IEEE Trans. Evol. Comput., 2016, 20: 645−665. doi: 10.1109/TEVC.2015.2504730
- Groen, D.; Arabnejad, H.; Suleimenova, D.; et al. FabSim3: An automation toolkit for verified simulations using high performance computing. Comput. Phys. Commun., 2023, 283: 108596. doi: 10.1016/j.cpc.2022.108596
- Suleimenova, D.; Groen, D. How policy decisions affect refugee journeys in south Sudan: A study using automated ensemble simulations. J. Artif. Soc. Soc. Simul., 2020, 23: 2. doi: 10.18564/jasss.4193
- Bosak, B.; Piontek, T.; Karlshoefer, P.;
et al . Verification, validation and uncertainty quantification of large-scale applications with QCG-PilotJob. InProceedings of the 21st International Conference on Computational Science ,Krakow ,Poland ,16–18 June 2021 ; Springer: Berlin/Heidelberg, Germany, 2021; pp. 495–501. doi: 10.1007/978-3-030-77977-1_39 - Schweimer, C.; Geiger, B. C.; Wang, M. Z.; et al. A route pruning algorithm for an automated geographic location graph construction. Sci. Rep., 2021, 11: 11547. doi: 10.1038/s41598-021-90943-8
- Deb, K.; Agrawal, R. B. Simulated binary crossover for continuous search space. Complex Syst., 1995, 9: 115−148
- Deb, K.; Goyal, M. A combined genetic adaptive search (GeneAS) for engineering design. Comput. Sci. Inf., 1996, 26: 30−45
- Zitzler, E.; Thiele, L. Multiobjective evolutionary algorithms: A comparative case study and the strength Pareto approach. IEEE Trans. Evol. Comput., 1999, 3: 257−271. doi: 10.1109/4235.797969
- Li, M. Q.; Yao, X. Quality evaluation of solution sets in multiobjective optimisation: A survey. ACM Comput. Surv., 2020, 52: 26. doi: 10.1145/3300148
- Li, M. Q.; Chen, T.; Yao, X. How to evaluate solutions in pareto-based search-based software engineering: A critical review and methodological guidance. IEEE Trans. Software Eng., 2022, 48: 1771−1799. doi: 10.1109/TSE.2020.3036108
- Li, M. Q. Is our archiving reliable? Multiobjective archiving methods on “simple” artificial input sequences. ACM Trans. Evol. Learn. Optim., 2021, 1: 9. doi: 10.1145/3465335
- Li, M. Q.; Zhen, L. L.; Yao, X. How to read many-objective solution sets in parallel coordinates [educational forum]. IEEE Comput. Intell. Mag., 2017, 12: 88−100. doi: 10.1109/MCI.2017.2742869
- Liu, W. B.; Wang, Z. D.; Zeng, N. Y.; et al. A novel randomised particle swarm optimizer. Int. J. Mach. Learn. Cybern., 2021, 12: 529−540. doi: 10.1007/s13042-020-01186-4
- Liu, W. B.; Wang, Z. D.; Yuan, Y.; et al. A novel sigmoid-function-based adaptive weighted particle swarm optimizer. IEEE Trans. Cybern., 2021, 51: 1085−1093. doi: 10.1109/TCYB.2019.2925015
- Sheng, M. M.; Chen, S. Y.; Liu, W. B.; et al. A differential evolution with adaptive neighborhood mutation and local search for multi-modal optimization. Neurocomputing, 2022, 489: 309−322. doi: 10.1016/j.neucom.2022.03.013
- Sangaiah, A. K.; Khanduzi, R. Tabu search with simulated annealing for solving a location–protection–disruption in hub network. Appl. Soft Comput., 2022, 114: 108056. doi: 10.1016/j.asoc.2021.108056