Downloads
 Download


This work is licensed under a Creative Commons Attribution 4.0 International License.
Article
Contact Model Considering Coupling Action of Topography and Friction Heat
Qingpeng Wang *, Shihao Ning, Jinjing Hu, Shaoyun Lv, Tiantian Han, Heng Wang and Zhenfeng Wang
College of Mechanical and Electrical Engineering, Henan Agricultural University, Zhengzhou 450002, China
* Correspondence: welcomewqp@163.com
Received: 8 July 2024; Revised: 12 September 2024; Accepted: 19 September 2024; Published: 26 September 2024
Abstract: Based on the deterministic contact model, the effects of the substrate deformation, thermal deformation and asperity interaction are considered to investigate the change laws of the contact properties at interface. Firstly, a new contact model of nominally flat rough surfaces is developed to consider these effects. Subsequently, the contact area of the proposed model is analyzed through a set of research schemes. Then, the change laws of the asperity properties can be obtained through different normal displacements, sampling intervals and roughness values. The results show that the linear relationship between the contact area and the normal load agrees well with the existing work. It can lead to a decrease of the asperity-peak height and the contact area to consider the substrate deformation, compared with that of the independent asperity, the opposite is true for the thermal deformation and asperity interaction. The effects of the substrate deformation and asperity interaction will become more significant when the greater normal displacements, smaller sampling intervals and roughness values are applied. However, it is more obvious for the thermal deformation when the normal load, sampling interval and roughness become greater. It can provide a more accurate change laws for the contact properties to introduce the substrate deformation, thermal deformation and asperity interaction.
Keywords:
contact model rough topography friction heat contact properties1. Introduction
As the size of micro-devices continues to decrease, the scale effect and the coupling mechanism of various physical fields at interface become more and more obvious, which show an important impact on the design of automobile, mechanical property, dynamic response and service life of the system, etc. [1–3] How to establish a contact model with multi-scale and multi-physical fields has become a key scientific and technological problem that needs to be solved for the improvement of equipment performance [4–6].
In order to investigate the interfacial contact properties, currently, the influential factors of geometrical morphology, contact status, surface characterization and different physical fields, etc. for the individual asperity are mainly investigated. Based on the analysis of individual asperity, the contact characteristics of rough surface can be further researched. For the geometrical shape of individual asperity, the following are often used: sphere, ellipsoid, cylinder and cone, etc. [1,5,7,8] Many researchers prefer to study the sphere contact theoretically and experimentally because it is simpler to work than other shapes [9,10]. About the contact status between the two interacting objects, the main evolution process is: perfectly elastic [11] → perfectly plastic [12] → elastic-plastic [13] → elastic-mixed elastic-plastic [14] → elastic-mixed elastic-plastic [15] → mixed elastic-plastic [16]. In order to extend the contact properties of an individual sphere to the whole rough surface, the main characterization methods are probabilistic statistics, fractal theory, numerical simulation and deterministic theory [8,10,17]. The existing problem of the first two is how to effectively deal with the substrate deformation and the interaction between asperities [18–20]. For the numerical simulation method, it needs to cost a large amount of computation time. In the deterministic contact theory, a continuous equivalent rough surface can be obtained through the identification criteria of the asperity peak, and it can provide an effective reference baseline for the variations of the contact properties [10]. Therefore, it is a feasible method to construct a deterministic contact model for the contact analysis of rough surfaces.
In order to reflect realistically the change laws of contact properties at interface, some scholars have begun to study the effects of the asperity interaction, substrate deformation and friction heat. Ciavarella et al. assumed that the contact pressure p is uniformly distributed over the apparent area A to consider the effect of the asperity interaction based on the elastic contact theory. The cumulative effect of the interaction reduces the deformation (pA1/2/E, where E is Young’s modulus), however, the change becomes obvious at moderate loads [18]. In literature [21], the variation of normal contact stiffness was analyzed through a similar approach. Afferrante et al. used the approximation methods of first-order and second-order Gaussian curvature, and took the geometric average of the curvature for the two adjacent asperities as the value of the new one, and the interaction between asperities can cause the redistribution of the contact forces on the rough surface [22]. In literature [23], the deterministic contact theory was applied, and the neighboring asperities can be merged if the geometrical overlap and the surface energy are greater than the given values. Yeo et al. divided the rough surface into two parts, the asperities and the substrate [24], which can be equivalent to two springs with stiffness values ka and kb in series, so that the total stiffness of the rough surface is k = [1/ka + 1/kb]-1. In literature [20], a joint closure deformation model was developed to consider the deformations of the asperity and the substrate using the same approach. With the geometrical scale decreasing, the effect of the frictional heat plays an important role for the contact properties [5,25,26]. Smith et al. developed a finite element model of a pair of hemispheres with substrate moving in relative motion, and the results show that the temperature at flashpoint is much higher than that at the substrate, it may lead to local softening, melting, and phase transformation of the contact materials, etc. [27] The sliding experiment between a hemisphere and a disk was proceeded by Rowe et al., and it shows that the local transient temperature is much higher than the average, which will lead to the reconstruction of the surface morphology [28].
In the process of interaction between two rough surfaces, the applied load leads to the change of the functional structure for the contact surfaces owing to the general uniformity between the surface morphology and the functional structure, meanwhile, the surface morphology is bound to change accordingly. It is important how to effectively express the changes of the contact properties in the sliding process. Currently, theoretical modeling and characterizing of solid contact at interfaces are imperfect. Additionally, there is a lack of corresponding measurement principles and techniques for evaluating contact properties. For these reasons, the deterministic contact model can be applied to obtain an initial baseline by connecting the equivalent circle centers, and then the influential factors of the substrate deformation, thermal deformation and asperity interaction are analyzed through a set of research schemes. Finally, the change laws of the asperity properties for the rough surfaces can be obtained through different normal displacements, sampling intervals and roughness values.
2. Modeling of Individual Spherical Asperity
2.1. Modeling Assumption
In order to simplify the analysis process, the contact model developed in this paper is based on the following assumptions.
(1) The materials of the contacting objects are homogeneous and isotropic;
(2) Only the normal contact and there is no oblique impact;
(3) It is a uniform motion in the sliding process, and only the heat conduction at interface is considered, ignoring the effects of the convection and radiation;
(4) Only dry friction occurs at interface and the effect of the fluid is not considered.
According to the method of classical GW model [9], the contact between two rough surfaces can be replaced by a rough surface with equivalent elastic modulus and a rigid smooth plane. The equivalent elastic modulus and yield strength are respectively calculated as follows
where Ei, νi and σyi (i = 1, 2) are Young’s modulus, Poisson’s ratio and yield strength of the two contacting objects, respectively.
2.2. Sphere Contact Model
The asperities may flow plastically when they come into contact because each asperity is covered with microasperities, and each microasperity with micromicroasperites [18,22–24]. So we can believe that there should be plastic flow at first for the contact asperities, but the percentage of which is very small. In reality, the dislocations existed in the material will be activated and grow up, and the status of the material is plastic owing to the increasing interaction between them. The development of the plastic deformation during the loading process will lead to “elastic islands”, which result in the decay of the ability to resist the deformation. The material in the fully plastic regime will exhibit work hardening on account of the restriction of dislocation movement caused by the deformation of the material microstructure [23]. Hence, the contact status should contain both elastic and plastic components in the contact process, and the corresponding contact area and load are respectively
where r is the spherical radius, δ is the normal deformation and p0 is the average contact pressure. The functions of f1(δ) and f2(δ) are two different mathematical models used to determine the percentage change for the elastic and plastic status, respectively, i.e.,
where n is the Meyer hardness exponent.
In order to expand the contact properties of a single sphere to the whole rough surface, in literature [10], based on the criterion of 3-point peak, the asperity-peak with “valley-peak-valley” mode was defined to realize a continuum surface profile through the valley points shared by the neighbouring asperities. For two-dimensional rough surface contours, firstly, it is labeled as a peak point on the profile by comparing three points, if the middle point is higher than the neighbours, and vice versa, it is labeled as a valley point. Secondly, on the basis of the above identification, further search for “peak above peaks” and “valley below valleys”, i.e., the identified peaks or valleys can be subdivided into more subtle structures. Finally, the results of the second step are matched to ensure that the formation of each asperity-peak follows the pattern of “valley-peak-valley”, i.e., each intermediate peak must be flanked by two neighbouring valleys, as shown in Figure 1.
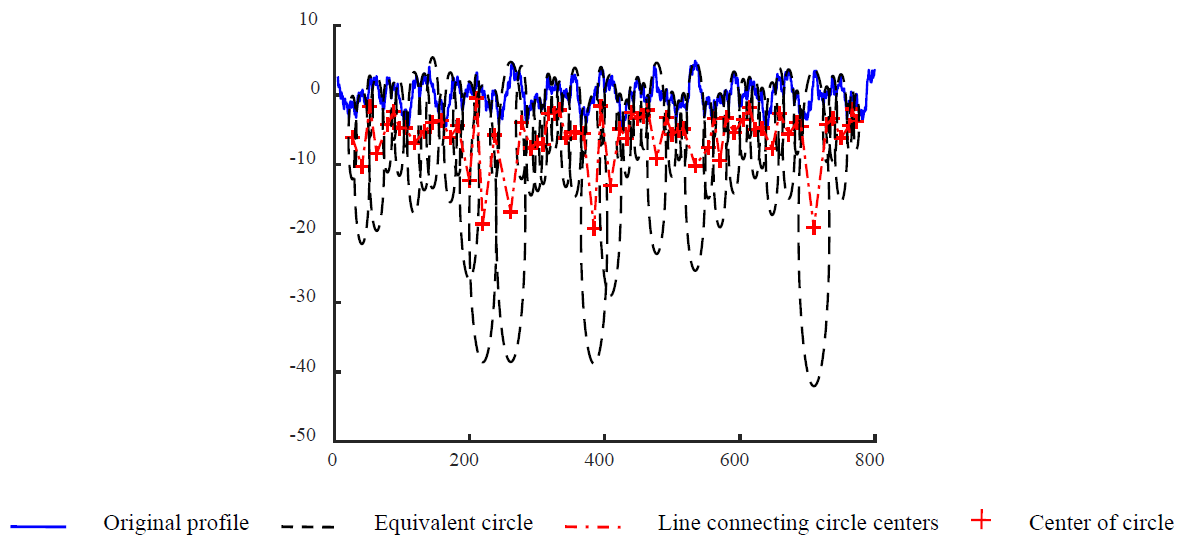
Figure 1. Rough surface profile and its equivalent asperity peaks.
2.3. Substrate Deformation
When an asperity on the rough surface is applied to an external load, which not only causes the deformation of the asperity itself, but also the decrease of the substrate. Assuming that the status of the contact materials is fully elastic, the substrate deformation caused by the applied load on the asperity is [29]
where d is the distance between the contacting asperity and the neighboring one, pmax is the maximum Hertz contact pressure, and rc is the contact radius.
The loaded asperity can lead to the deformations of the corresponding substrates of all asperities on the rough surface, so the total substrate deformation caused by a single loaded asperity is
where nc is the number of the asperities which come into the contact with a plane.
2.4. Thermal Deformation
When a spherical asperity slides on a plane, the generation rate of frictional heat is
where μ is the friction coefficient, p is the contact pressure, and v is the relative sliding velocity between the sphere and the plane.
Assuming that all the frictional heat is used to heat the sphere and the plane, and the densities of the heat flow input the sphere and the plane are q b and qp, respectively, so the total heat flow density is
Different contact materials will result in various heat flow densities, and the coefficient of the heat distribution for the sphere is
In the above formula, the variable k is
and
where λ is the coefficient of heat conduction, κ is the coefficient of heat diffusion, ρ is the density, and Cp is the specific heat.
From Equations (9) and (10), the heat entered into the sphere and the plane can be written as
According to Fourier’s law
In steady-state condition, the lateral heat flow is neglected, and it can be obtained
The temperature distribution is obtained by Laplace transform [30]
and
where vs is the whole sliding velocity.
About the temperature change at interface, i.e., z = 0, Equation (14) can be rewritten as
Because the maximum of the interfacial temperature is much higher than the average, the latter is applied to this calculation. The thermal deformation of the sphere is
where Tmean is the average temperature rise at interface.
2.5. Asperity Interaction
The contacts between rough interfaces are a complex system included various scales, such as surface structures, asperities, material crystals, molecules, atoms, etc., and the construction of the rough surface is constantly in motion and changing. The surface energy at interface arises mainly because the chemical bonds between the molecules are broken, and they cannot be compensated. Although surface energy and surface tension are different in concept, their values are the same.
The changes of the surface topography at interface are similar to that of the Earth’s plate motion, except for the difference in scale, which involves some interactions such as collision, extrusion, subduction, etc. The formation of the Tibetan Plateau is due to the collision of the two plates. Therefore, it can be inferred that the same interaction should also exist in neighboring asperities. In fact, the two asperities at interface can be flattened to merge a larger asperity which can withstand greater external load.
When the rough interface is subjected to the mechanical and thermal loads, the asperities come into contact with the others, high stress develops locally and plastic deformation is unavoidable. The surface profile can be flattened through the asperity interaction, and the corresponding surface topography is reconstructed. In literature [23], Wang et al. analyzed the change laws of 2D rough surface contact with asperity interaction, and pointed out that the bonding energy of the atoms facing outwards can’t be compensated, which leads to some extra energy on the solid surface layer. It has the same value in balancing the energy requirement between the unit area and the unit length. Meanwhile, based on the concept of geometrical overlap, the judgment criterion for the merging of adjacent asperities is proposed
where xc is the abscissa value of the circle center, xol is the overlap length of adjacent equivalent circles, and γsv is the solid surface energy.
According to the principle of volume conservation, a new asperity peak can be generated by merging the adjacent asperities.
where r’ is the radius of the generated circle.
After obtaining the radius of the generated circle, the location of the circle center can be obtained by the left and right endpoints of the adjacent asperities after deformation. A triangle can be constructed of the given two points and the radius, and then the location of the generated circle is determined by the circumcircle.
2.6. Calculation Process
When an equivalent rough surface slides on a rigid plane, the effects of the substrate deformation, thermal deformation and asperity interaction can be analyzed by the above-mentioned theories to obtain the change laws of the contact characteristics. The main calculation steps are as follows:
(1) Based on the deterministic criterion of “valley-peak-valley” mode, a continuous equivalent surface profile with a reference frame can be realized through the same valley points shared by neighbouring asperities.
(2) In the compressing process, the substrate deformation caused by an asperity applied external load is calculated firstly, and the total deformation can be obtained by adding up all the values of the asperities under loading. Then the asperities interacted with each other are merged.
(3) Similarly, in the sliding process, the total thermal deformation is calculated by the above-mentioned formula, and a new surface profile can be regenerated by the asperity coalescence.
The calculation flow is shown in Figure 2.
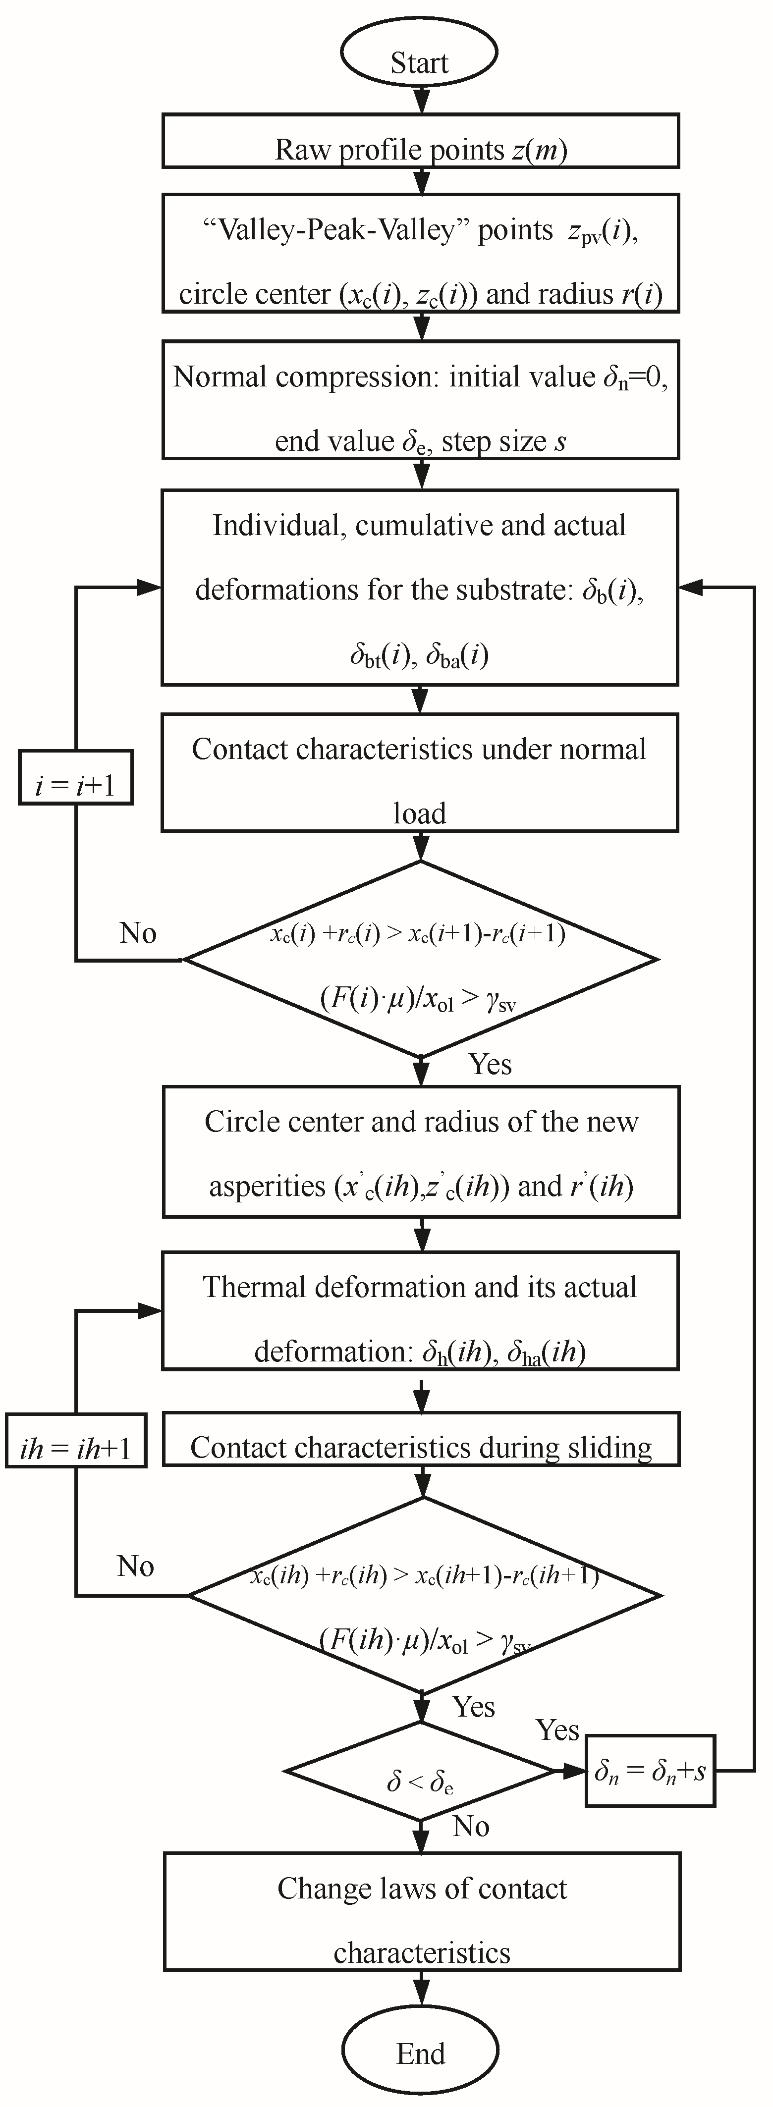
Figure 2. Calculation flow of contact characteristic parameters for rough surface.
3. Validation of the Proposed Model
3.1. Contact Area of Individual Sphere
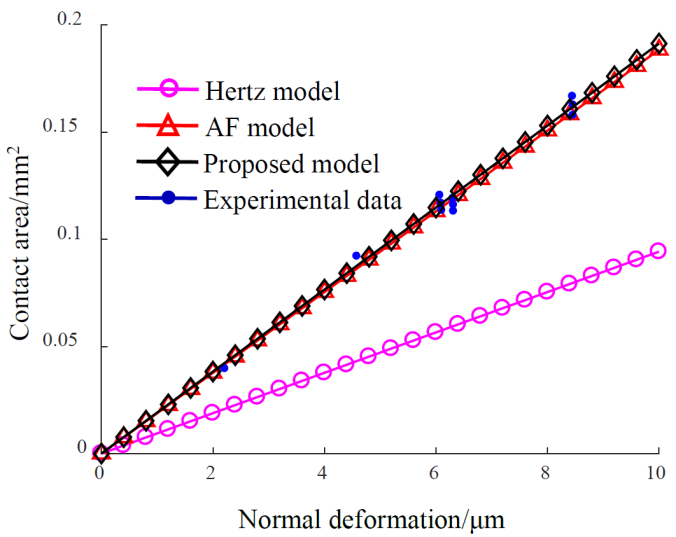
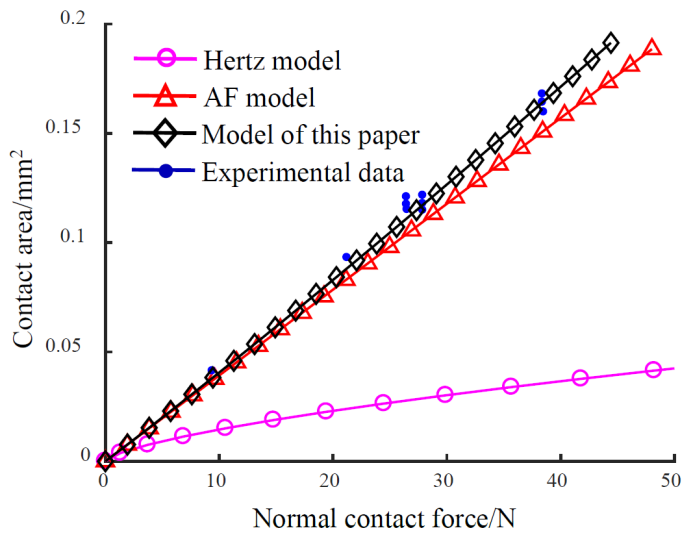
In order to verify the feasibility of the contact model proposed in this paper, the geometries and material properties of test specimens in the indentation experiments, which were proceeded by Jamari et al. [31] to study the compression of an aluminum alloy sphere using a silicon carbide flat surface, are applied, as listed in Table 1. Figure 3 gives the curves of the contact area versus normal parameters of the proposed model compared with the Hertz [11], AF [12] models and the above-mentioned measurements.
| Property | Value | |
|---|---|---|
| Diamond Plate | Aluminum Alloy Ball | |
| Densities/(kg/m3) | 3200 | 2750 |
| Yong’s modulus/GPa | 430 | 75.2 |
| Poisson’s ratio | 0.17 | 0.345 |
| Yield stress/MPa | — | 40 |
| Brinell hardness/(kgf/mm2) | 2485 | 26 |
| Meyer hardness index | — | 2.15 |
| Radius/mm | ∞ | 3 |
| Specific heat capacity/(J/(kg·K)) | 690 | 810 |
| Thermal conductivity/(W/(m·K)) | 50 | 120 |
(a) Normal deformation.
(b) Normal contact force.
Figure 3. The contact area versus (a) normal displacement and (b) contact force compared to the experimental data and two other contact models for the individual sphere.Normal deformation.Normal contact force.
In Figure 3a, the relationship between the contact area and the normal deformation is linear for Hertz, AF and the proposed model, while the contact area of the latter two is twice as large as the former and shown good agreement with the measurements. In Figure 3b, the curves of different models are also nearly linear, but become scattered. The AF and proposed models exhibit good agreement with the measurements, while the Hertz model shows poor agreement, and the obvious discrepancy can be seen at the lower forces. When the normal contact force increases, the divergence between different models and the measurements becomes more significant. The proposed model has a big advantage especially at the greater forces. The contact force corresponding to the elastic status is much larger than that of the other two for the same contact area. It is mainly due to the fact that the defects existing in the contact materials can lead to plastic flow, and the contact area becomes larger, however, the ability subjected to external load decreases.
3.2. Contact Area for Rough Surfaces
In order to analyze the effects of substrate deformation, thermal deformation and asperity interaction on the contact area of rough surfaces, eight scenarios are used for comparative analysis, as shown in Table 2.
| Number | Content | Number | Content |
|---|---|---|---|
| Case 1 | Independent asperity | Case 5 | Thermal deformation |
| Case 2 | Asperity interaction | Case 6 | Thermal deformation and asperity interaction |
| Case 3 | Substrate deformation | Case 7 | Thermal and substrate deformations |
| Case 4 | Asperity interaction and substrate deformation | Case 8 | Integrated action |
A set of different surface profiles can be obtained using the fractal method [11] for the purpose of this research. The parameters of the surface profile Ra and Rq are presented in Table 3 when the sampling length and interval are separately selected as 800 μm and 0.5 μm. The 4th surface profile and its equivalent asperities are shown in Figure 1. The contact material parameters are the same as those in Section 2.1. In the compressing process, 60 computational steps are taken from the highest point of the equivalent spherical asperity to the midline position of the rough surface profile. In the sliding process, the sliding velocity is taken as 4 m/s and the friction coefficient is 0.06. The results of the contact area are shown in Figure 4.
| Surface Profile | 1 | 2 | 3 | 4 | 5 | 6 | 7 |
|---|---|---|---|---|---|---|---|
| Ra/μm | 2.747 | 2.204 | 1.862 | 1.577 | 1.374 | 1.110 | 0.846 |
| Rq/μm | 3.376 | 2.712 | 2.293 | 1.944 | 1.695 | 1.371 | 1.045 |
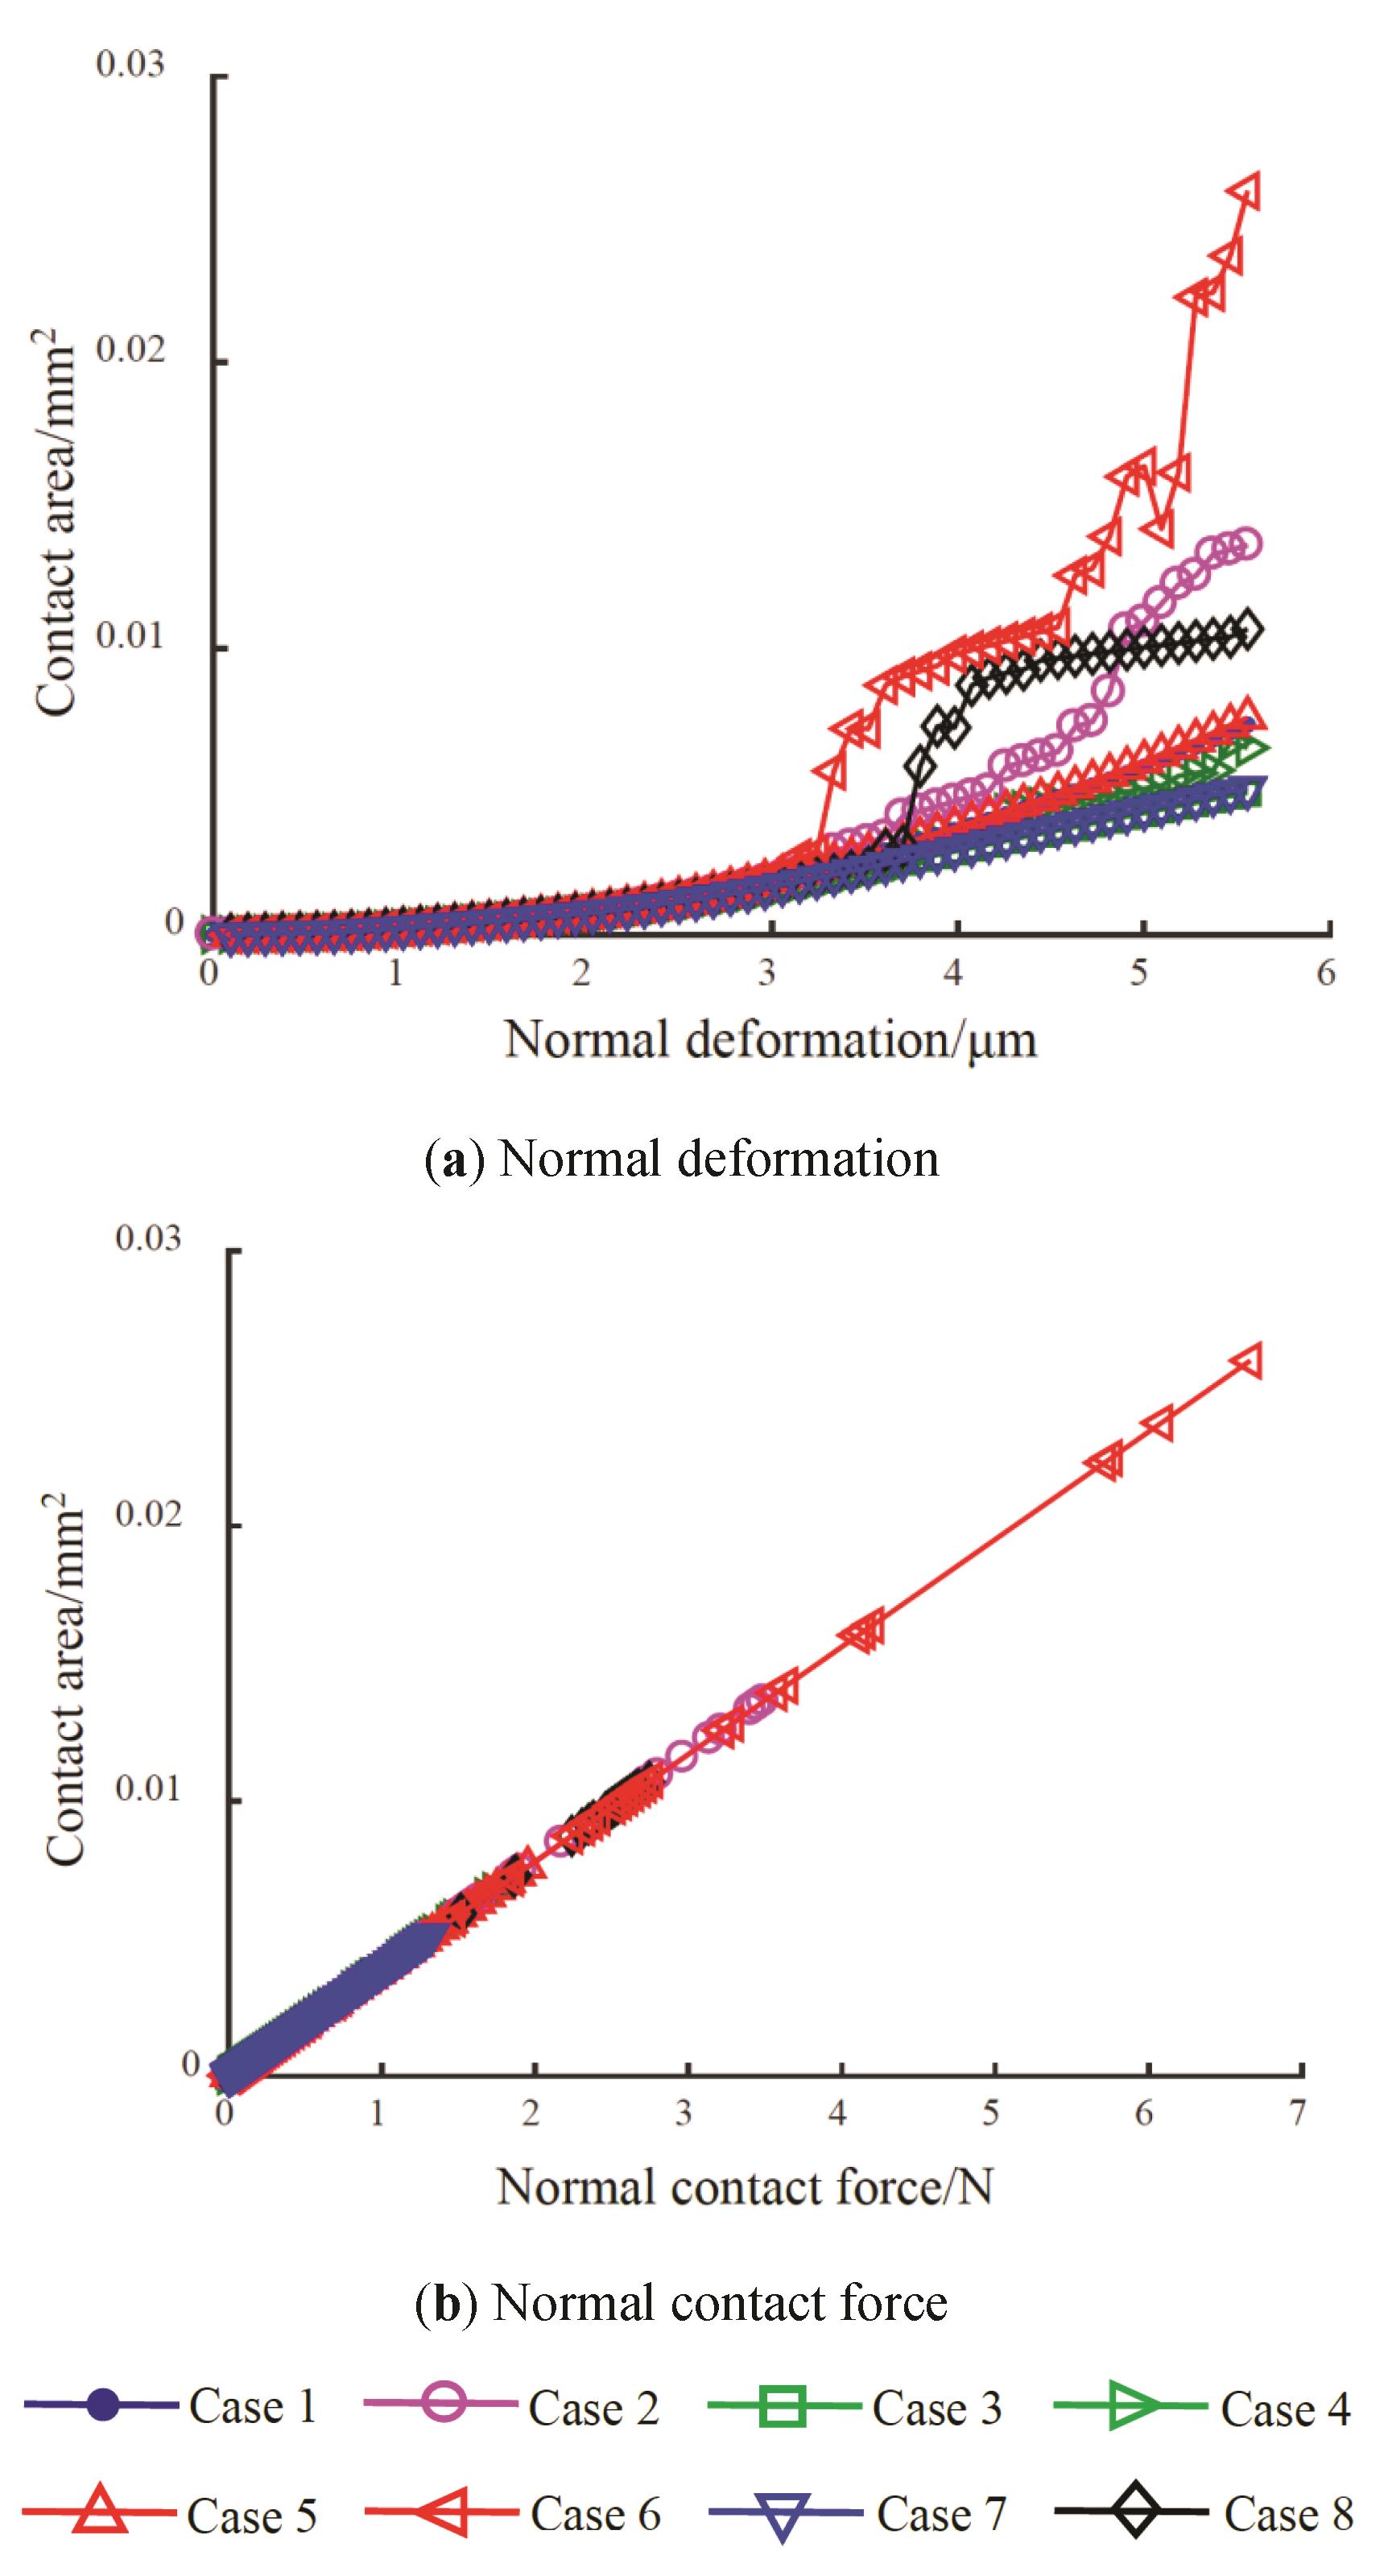
Figure 4. The contact area versus (a) normal displacement and (b) contact force for various research schemes.
In Figure 4a, the contact areas calculated by various research schemes all increase slowly at low displacements. However, for high displacements, the results of the cases 3, 7, 1 and 5 increase slightly in turn, and the cases 2 and 4 increase in zigzagging. They increase sharply at first for the cases 6 and 8, and then their change rates become low, while the former appears to increase obviously again with the displacement increasing. In summary, the substrate deformation can decrease the contact area, while the thermal deformation and the asperity interaction have the opposite effect. In Figure 4b, the relationship between the contact area and the contact force is linear for different cases, and similar results can be obtained from both GW [9] and BGT [32] models. Yastrebov et al. analyzed the compression of the rough surfaces from the initial to the full contact, and found that the contact area is nearly linear with the normal contact force [19].
4. Results and Analysis
4.1. Effect of Normal Deformation on Asperity-Peak Properties
In order to analyze the effect of normal load on the contact properties, the same cases as those in Section 2.2 are applied. Taking the initial line connecting the circle centers as a reference datum, the lines corresponding to different normal deformations are shown in Figure 5.
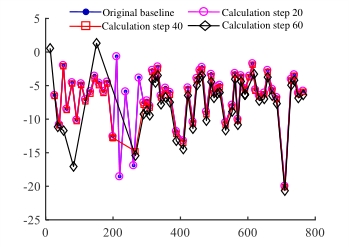
Figure 5. Reference baselines corresponding to different normal deformations.
As seen in Figure 5, the baseline in the 20th computation step is nearly consistent with the original, and it slightly decreases for the 40th computation step, except for a few increasing points due to the asperity interaction. The final position decreases slightly for x > 290 μm. By contrast, the position changes significantly for x < 290 μm, and the number of asperity peaks decreases obviously. It is mainly due to the fact that the thermal deformation and asperity interaction can lead to an increase of the baseline, however, an opposite effect for the substrate deformation. In fact, the surface will become rougher, which is in agreement with the reality.
Figure 6 displays the contact characteristics of various normal deformations. As can be seen in Figure 6a, there is no change in the number of asperity-peaks for examples 1, 3, 5, and 7, staying at 59. The results of the remaining cases are likewise 59 at first compression, but after the deformation of 3.06 μm, it is down to the final value of 5 for the case 6. Similarly, it declines gradually to 52 for the case 4. The two cases of asperity interaction and integrated action are in the above results. In Figure 6b, the average peak radius of the cases 1, 3, 5 and 7 is 8.26 μm, and the trends of the other four cases are just opposite to that of the asperity-peak number. The average peak height, as shown in Figure 6c, is maintained at 1.82 μm for the case 1. The results of the cases 5, 2 and 6 increase to 1.86, 4.84 and 9.05 μm, respectively. In comparison, it decreases to 0.94, 0.95 and 1.30 μm for the cases 3, 7 and 4, respectively. The result of the integrated action fluctuates around that of the case 1.
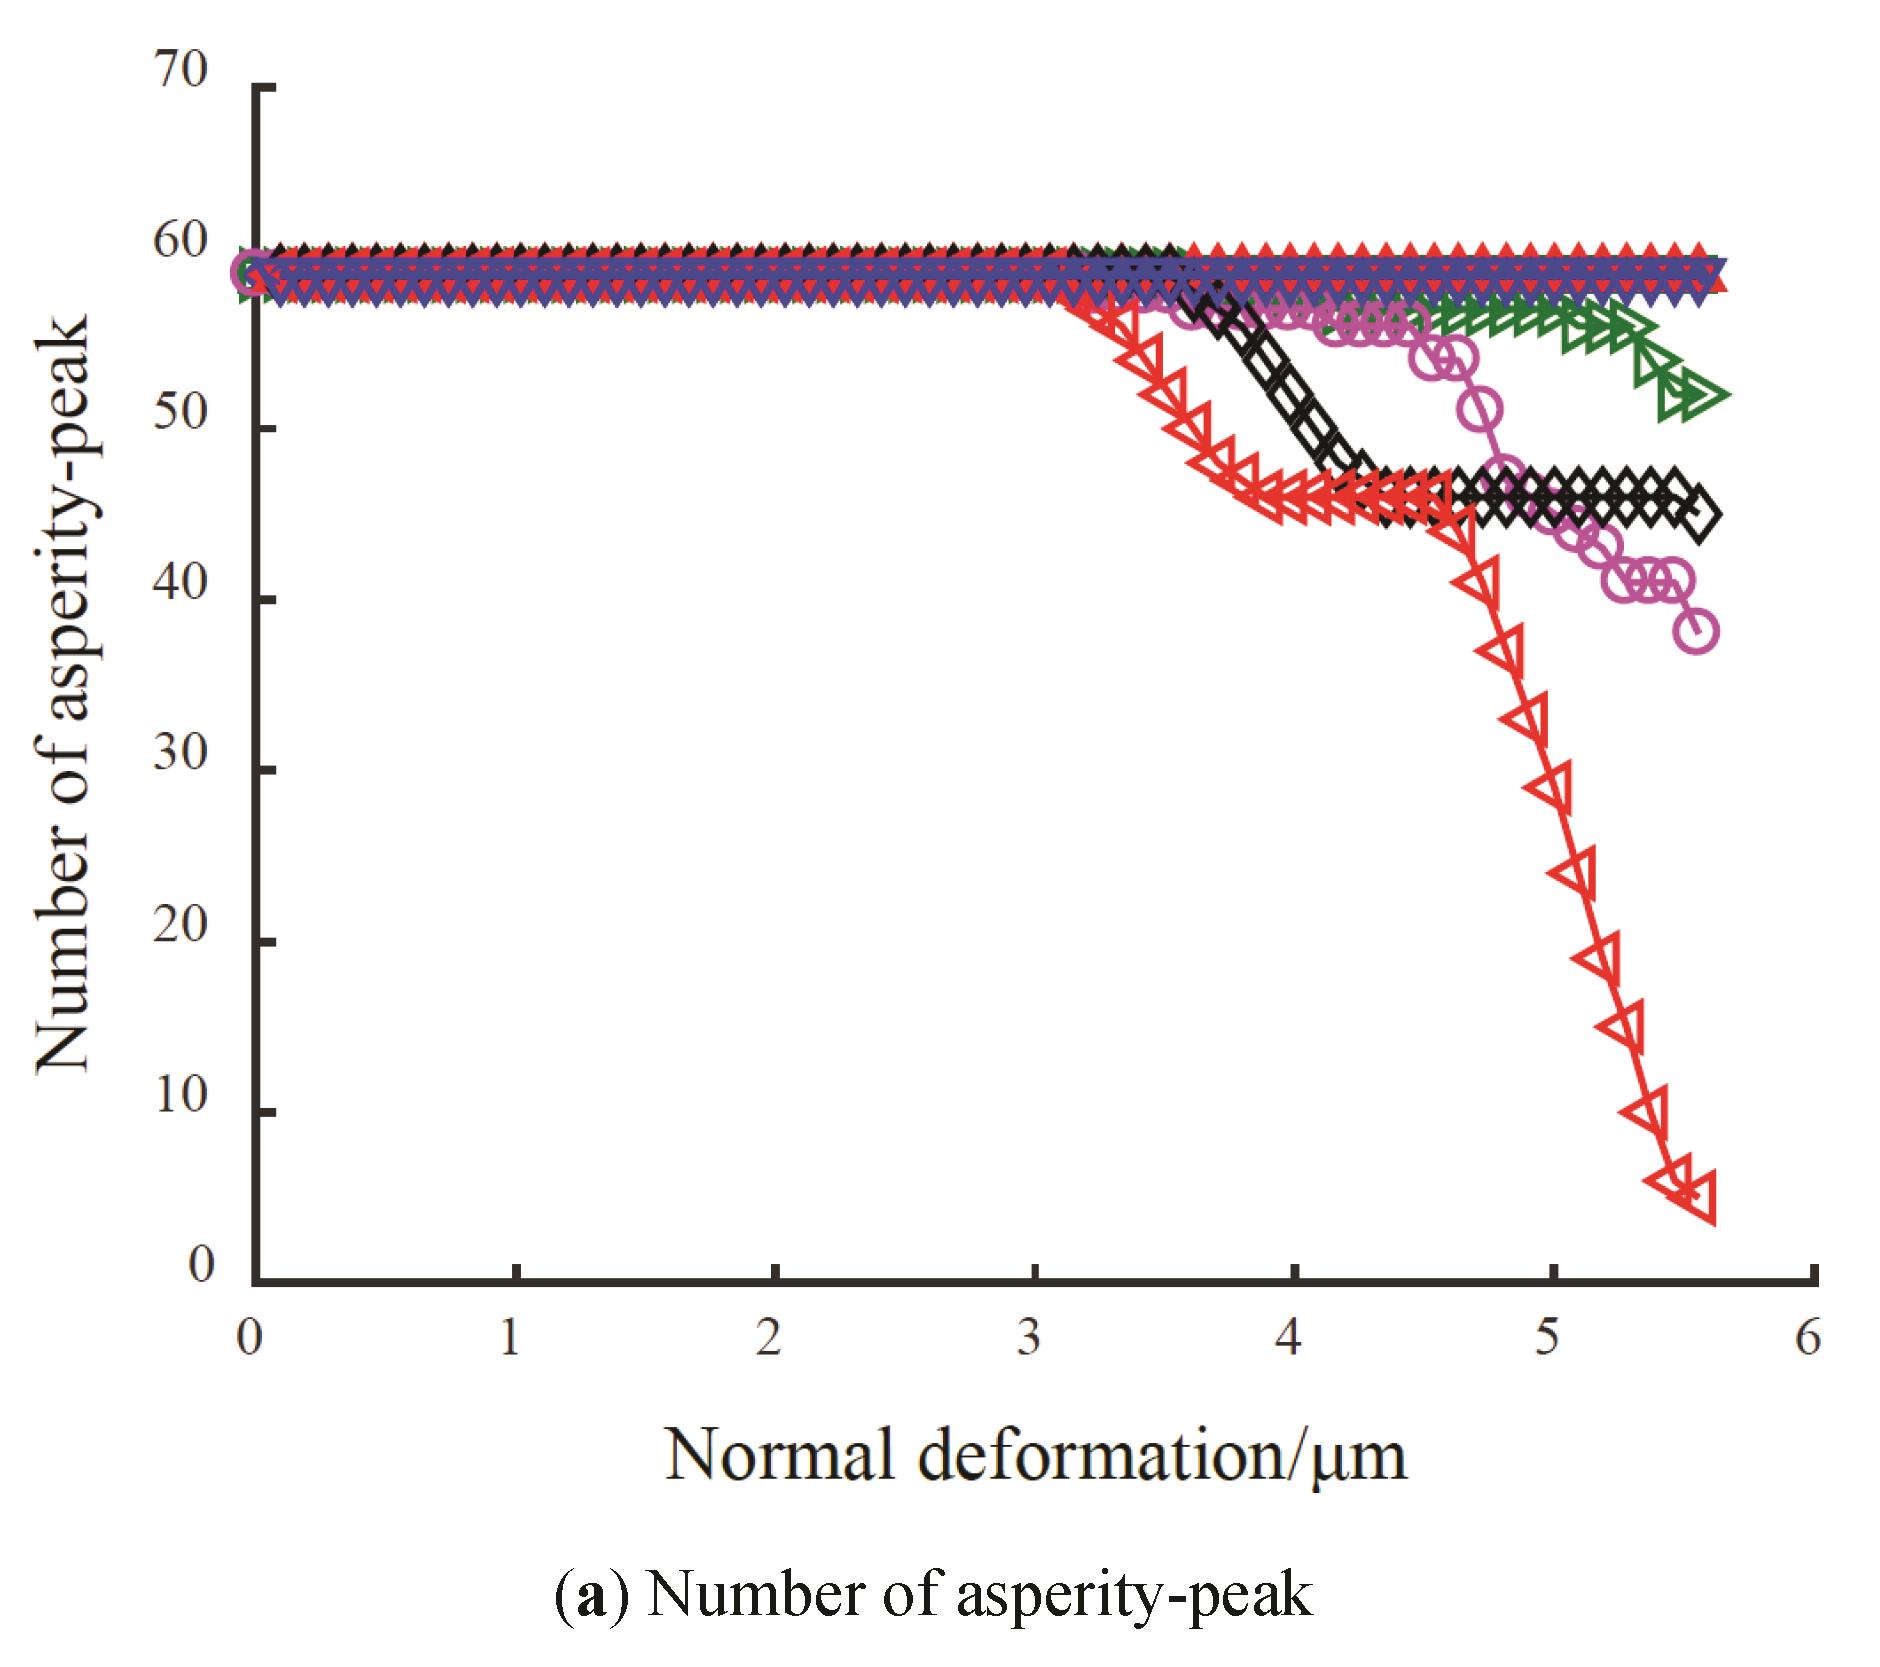
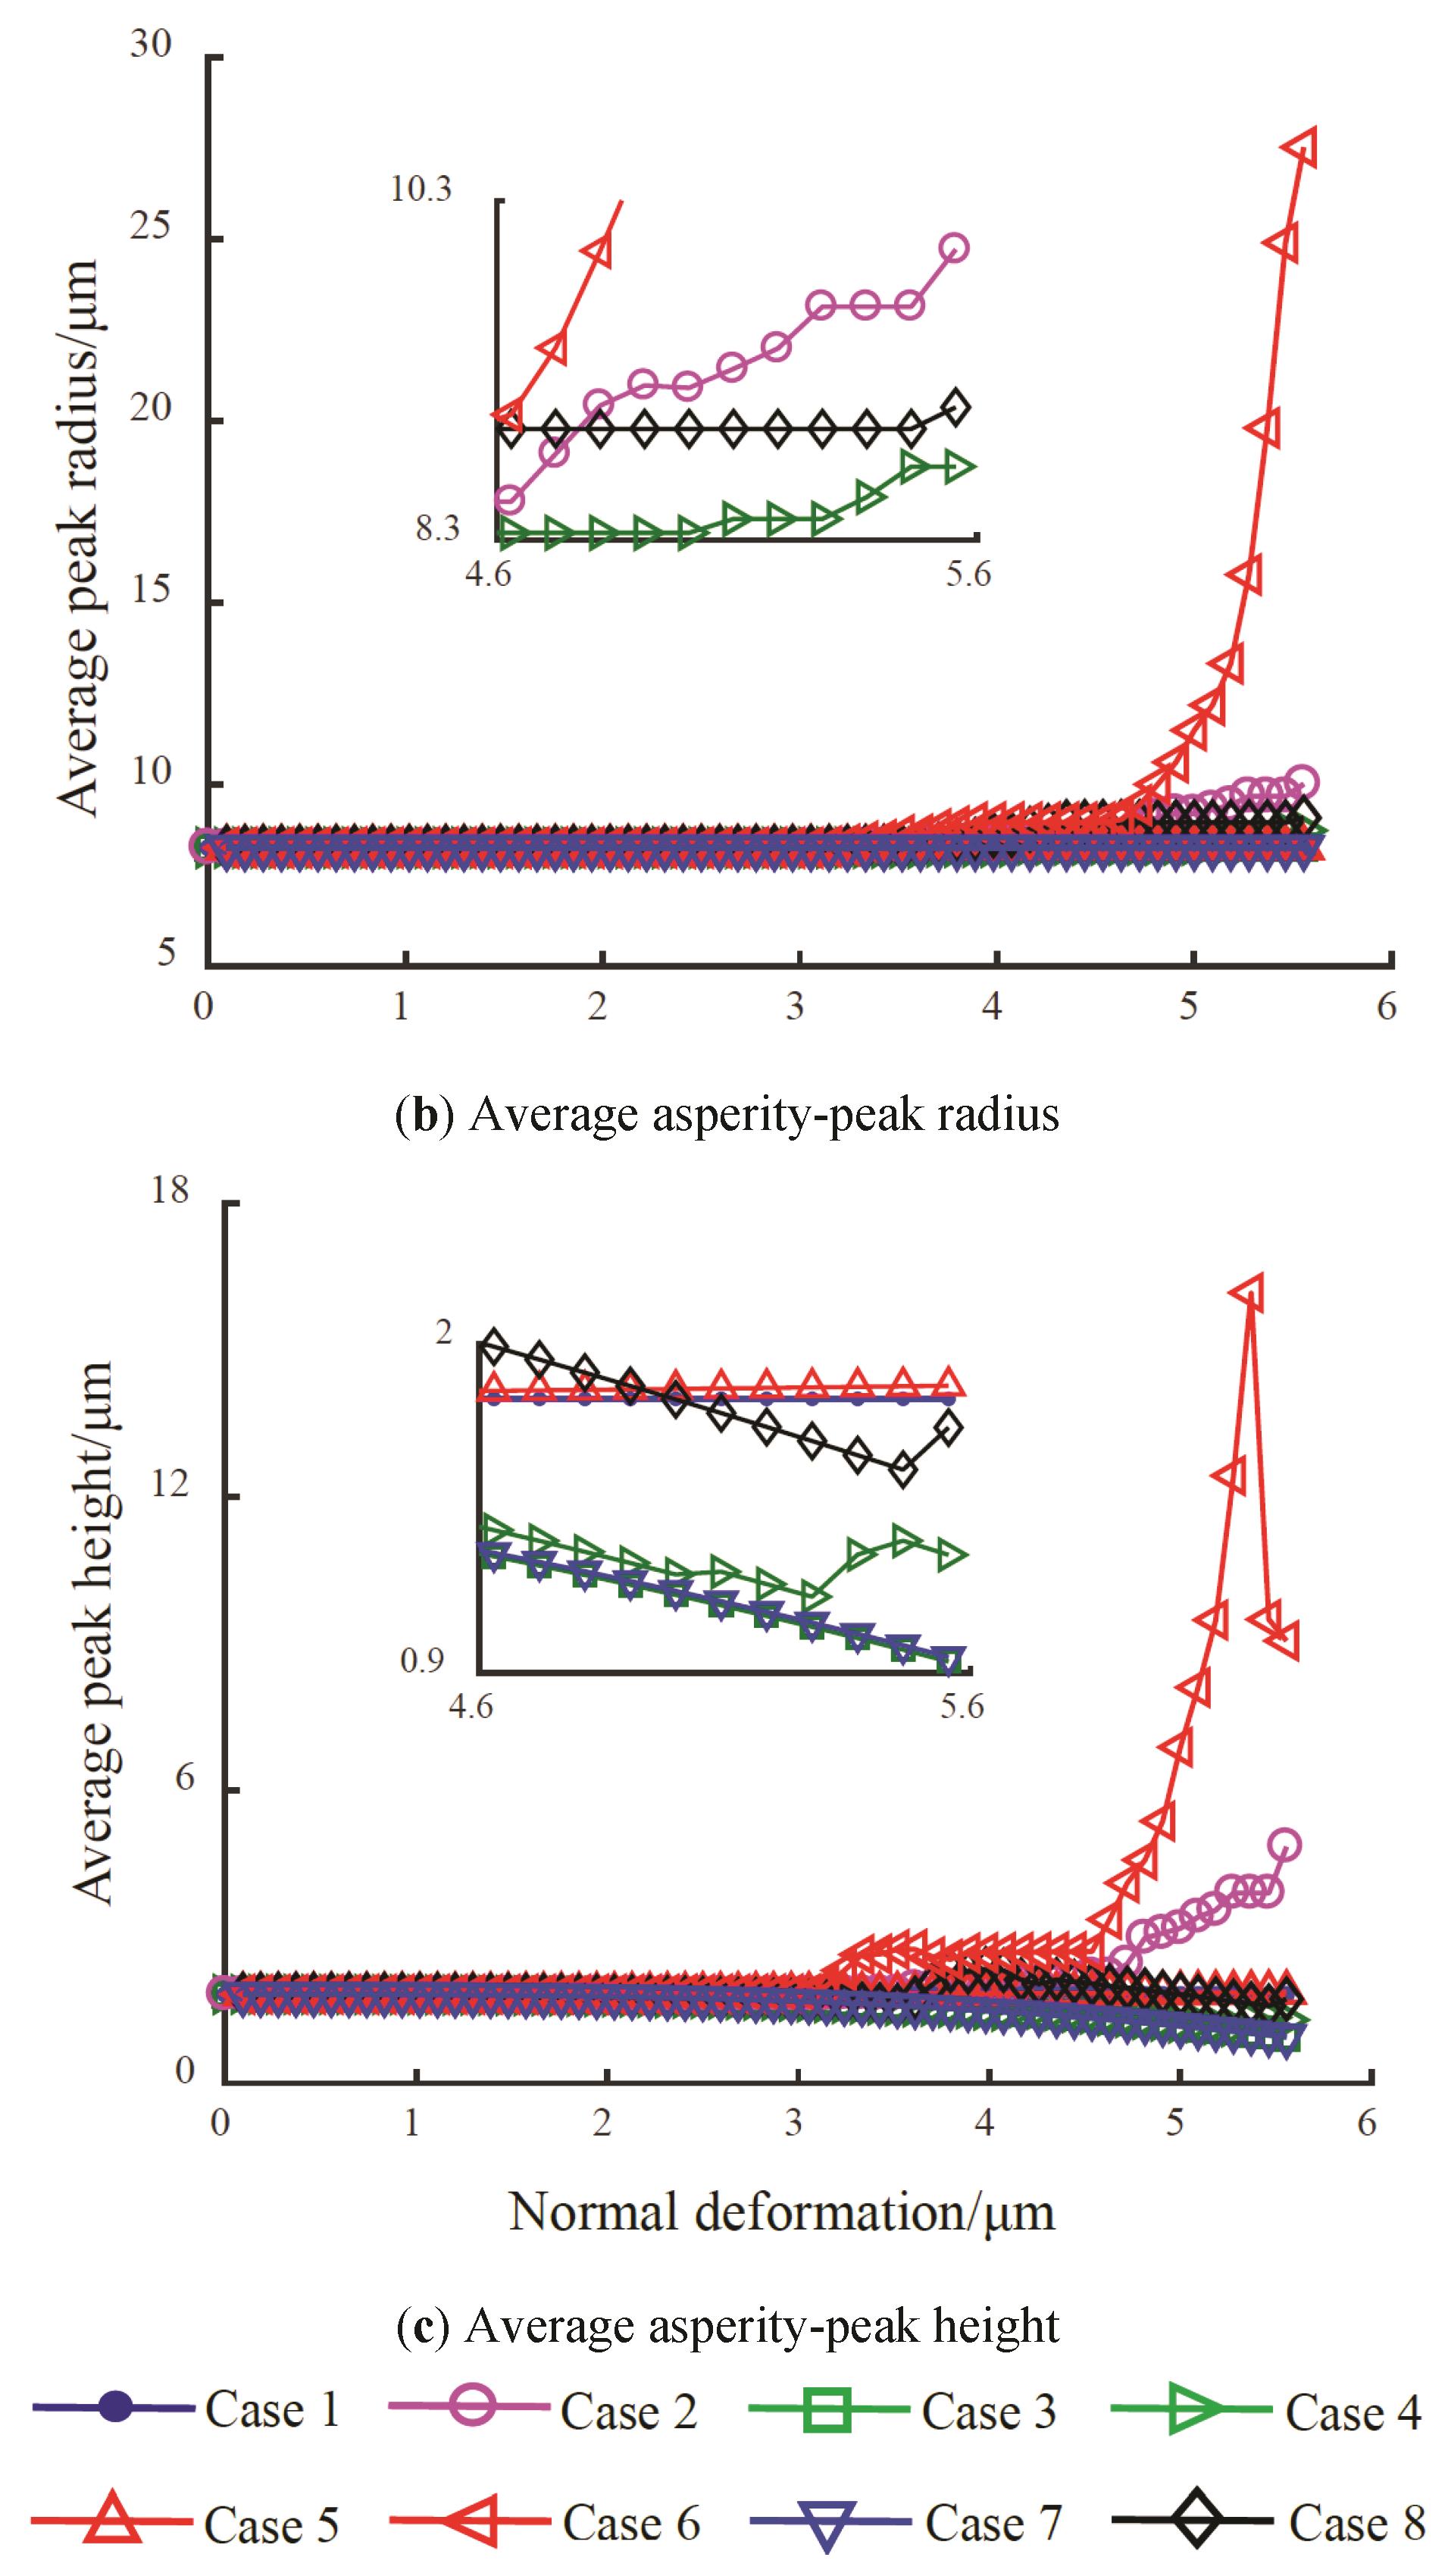
Figure 6. Asperity-peak properties: (a) the number per profile (b) their radii and (c) their heights in relation to different normal deformations.
The asperity subjected to external load can cause a decrease of the substrate position, which is similar to the deformation of a cantilever beam caused by applied load at the free end. When the external load is small, the force transmitted from the asperity to the substrate is not sufficient to produce a significant change, but distinct substrate deformation occurs with the external load increasing. The friction heat in the sliding process can cause thermal deformation of the contact materials, which inevitably leads to a rise of the asperity position owing to the limitation of the substrate material. Clearly, the change will become more obvious with the increase of the external load. The effect of the asperity interaction is not obvious for the light load at interface, which needs a small number of asperities to bear. With the external load increasing, the asperities with smaller scales can be deformed plastically, and they will merge into one with a larger scale to bear the external load. Thus, the number of the asperity-peak decreases, while the corresponding peak radius and height increase. It can be inferred that the asperity peaks on the rough surface will be flattened, and the valleys are filled in, when the external load is large enough, eventually, there will be only one asperity peak with infinite radius and height.
4.2. Effect of Sampling Interval on Asperity-Peak Properties
In order to analyze the effect of the sampling interval on the asperity-peak properties, it is set as 0.05, 0.1, 0.3 μm, and an interval of 0.5 μm in the range between 0.5 and 5 μm. The results are shown in Figure 7.
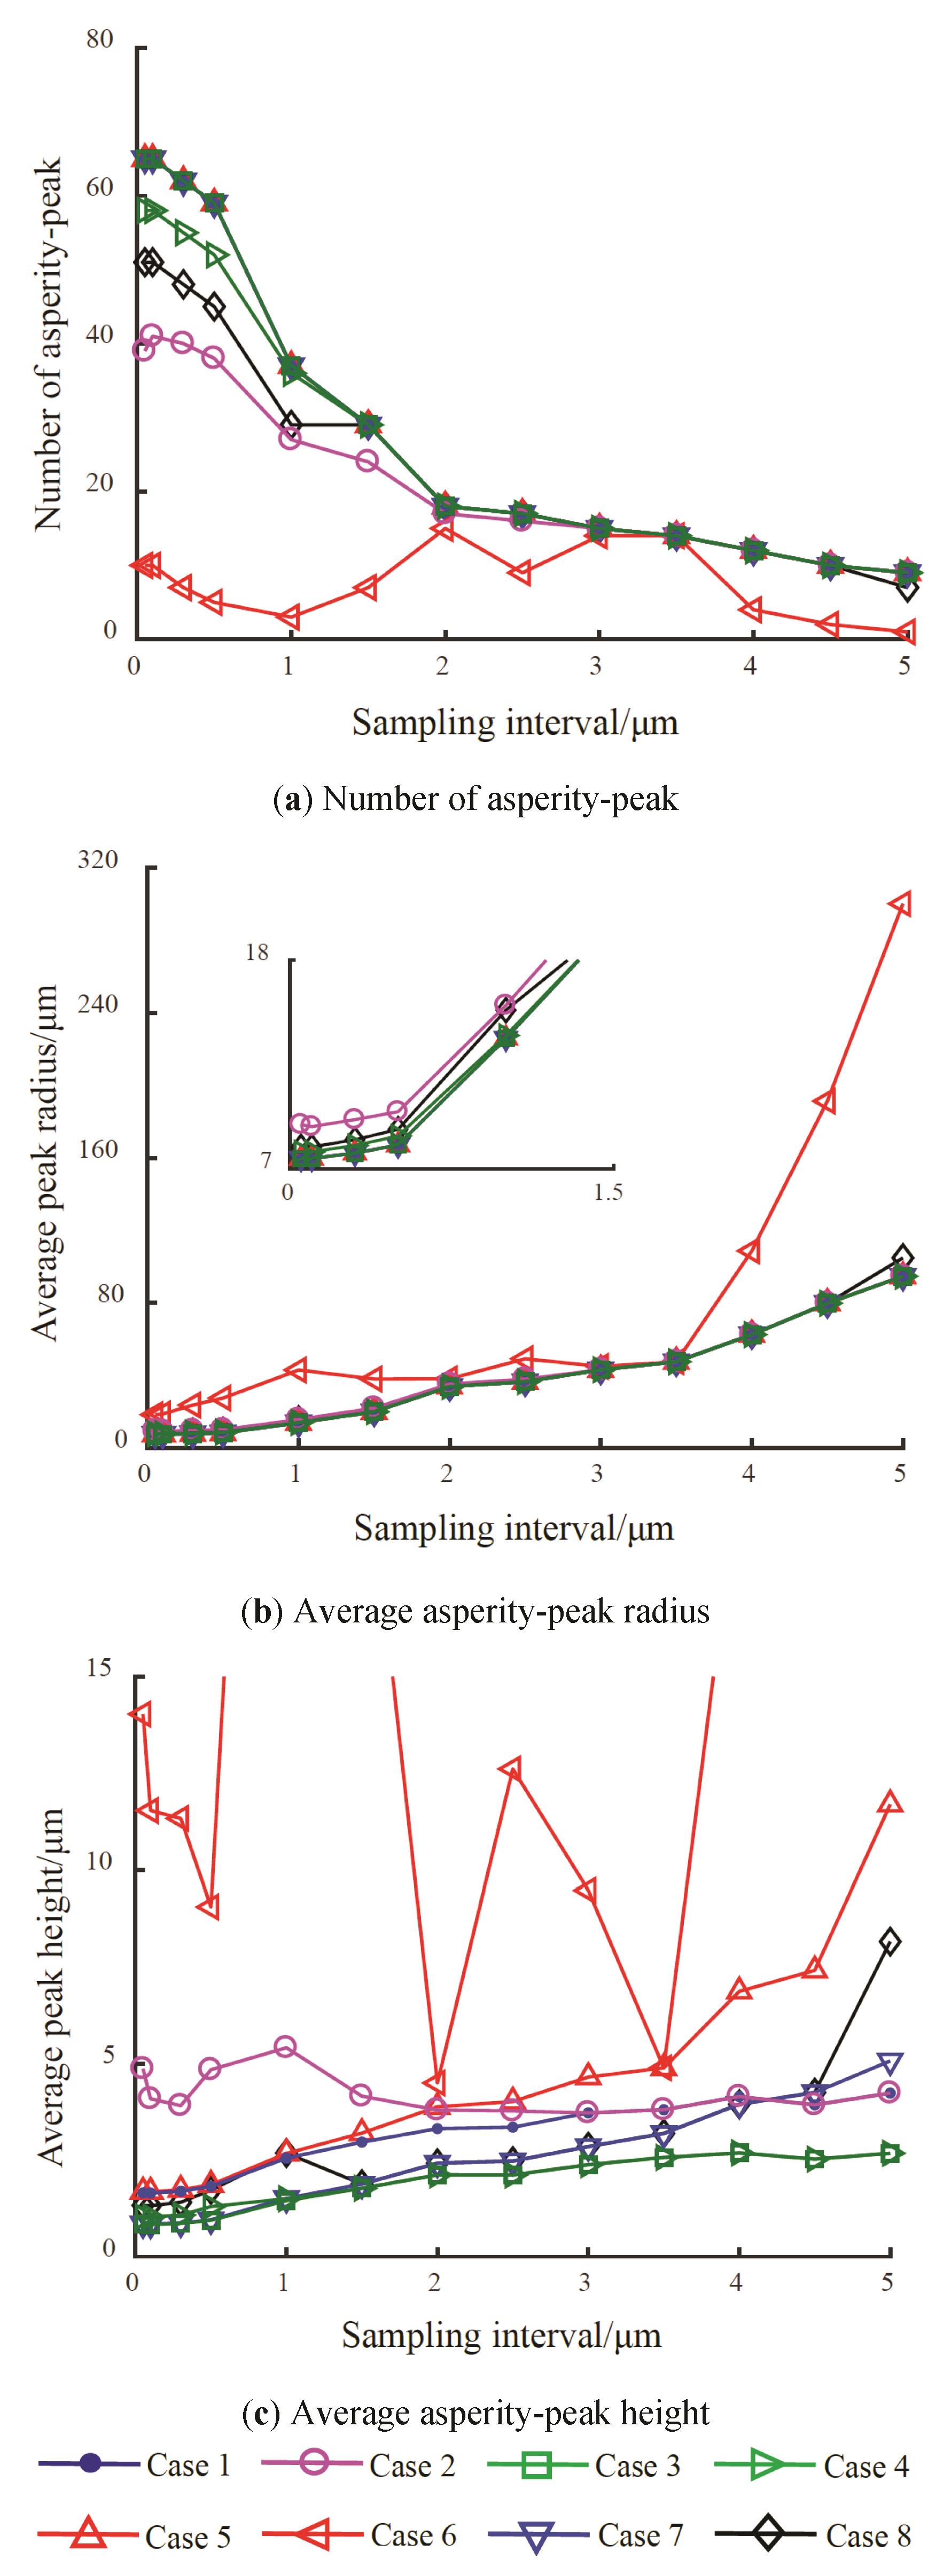
Figure 7. Asperity-peak properties: (a) the number per profile (b) their radii and (c) their heights in relation to different sampling intervals.
It can be observed from Figure 7a that the number of asperity-peak decreases with the increasing sampling interval. When the sampling interval is large enough, only a small number of the asperity peaks with larger size are presented on the equivalent rough surface, and the effects of different factors on the asperity-peak number are small. However, the greater deformation in the case 6 increases the probability of asperity merging, which results in a decrease in the number of asperity-peak. When the sampling interval decreases, the finer micro-structures are presented on the rough surface, and the number of equivalent peaks increases, just as the changes in the number of lattices, unit cells and atoms in a certain region. The changes of the number for the four cases, which do not take into account the asperity interaction, are largely consistent, increasing from a minimum of 9 to a maximum of 65. The number of case 6 is relatively few and has some fluctuations. The change trends for the other three scenarios are nearly similar, and the highest number is 58 for the case 4 when the sampling interval is 0.05 μm, followed by the cases 8 and 2 in decreasing order. The change trends of the asperity-peak radius, as shown in Figure 7b, are just opposite to that of the asperity-peak number. Except for the larger values of the case 6, the results of the other cases are all small, and become smaller with the sampling interval decreasing. The results of different cases are below 10 μm when the sampling interval is less than 0.5 μm.
The change laws of the average asperity-peak height are shown in Figure 7c. The result of the case 6 has large fluctuations, while a relatively stable value of 4 μm for the case 2. The trends of the other cases are approximately identical and show that the peak heights decrease with the sampling interval decreasing. When the sampling interval is 5 μm, the individual asperity is subjected to a larger load, and the effects of the substrate deformation and thermal deformation are obvious, their corresponding peak heights are respectively 2.67 and 11.69 μm. While the effect of the asperity interaction is small with the peak height of 4.23 μm.
When the sampling interval decreases, the asperities with a smaller scale can be shown on the rough surface. If the interaction between molecules is thought to be reasonable, the similar action should be existed between asperities as well, perhaps the mechanisms of interaction between the two are different. Actually, the smaller the geometric scale of the contact bodies, the more obvious the effect of the interaction. Meanwhile, the number of asperities came into contact increases, which can accelerate the cumulative effect of the substrate deformation. Conversely, the generated frictional heat and the corresponding deformation decrease. The result of the integrated action lies between that of the asperity interaction, the thermal deformation and the substrate deformation. When the sampling interval is less than 0.5 μm, the peak height basically varies between 0.8~1.9 μm.
4.3. Effect of Roughness on Asperity-Peak Properties
The relationships between the asperity-peak properties and the roughness are shown in Figure 8. The changes in different cases are relatively consistent and smooth, except for a large fluctuation for the case 6. With the roughness decreasing, the corresponding structure on the rough surface becomes finer, which can lead to an increase of the asperity-peak number and the radius, but a decrease of the asperity-peak height. Further, the effect of the asperity interaction becomes more pronounced, by contrast, it wears off for the substrate deformation and the thermal deformation owing to the weakened ability to bear the external load for the individual asperity.
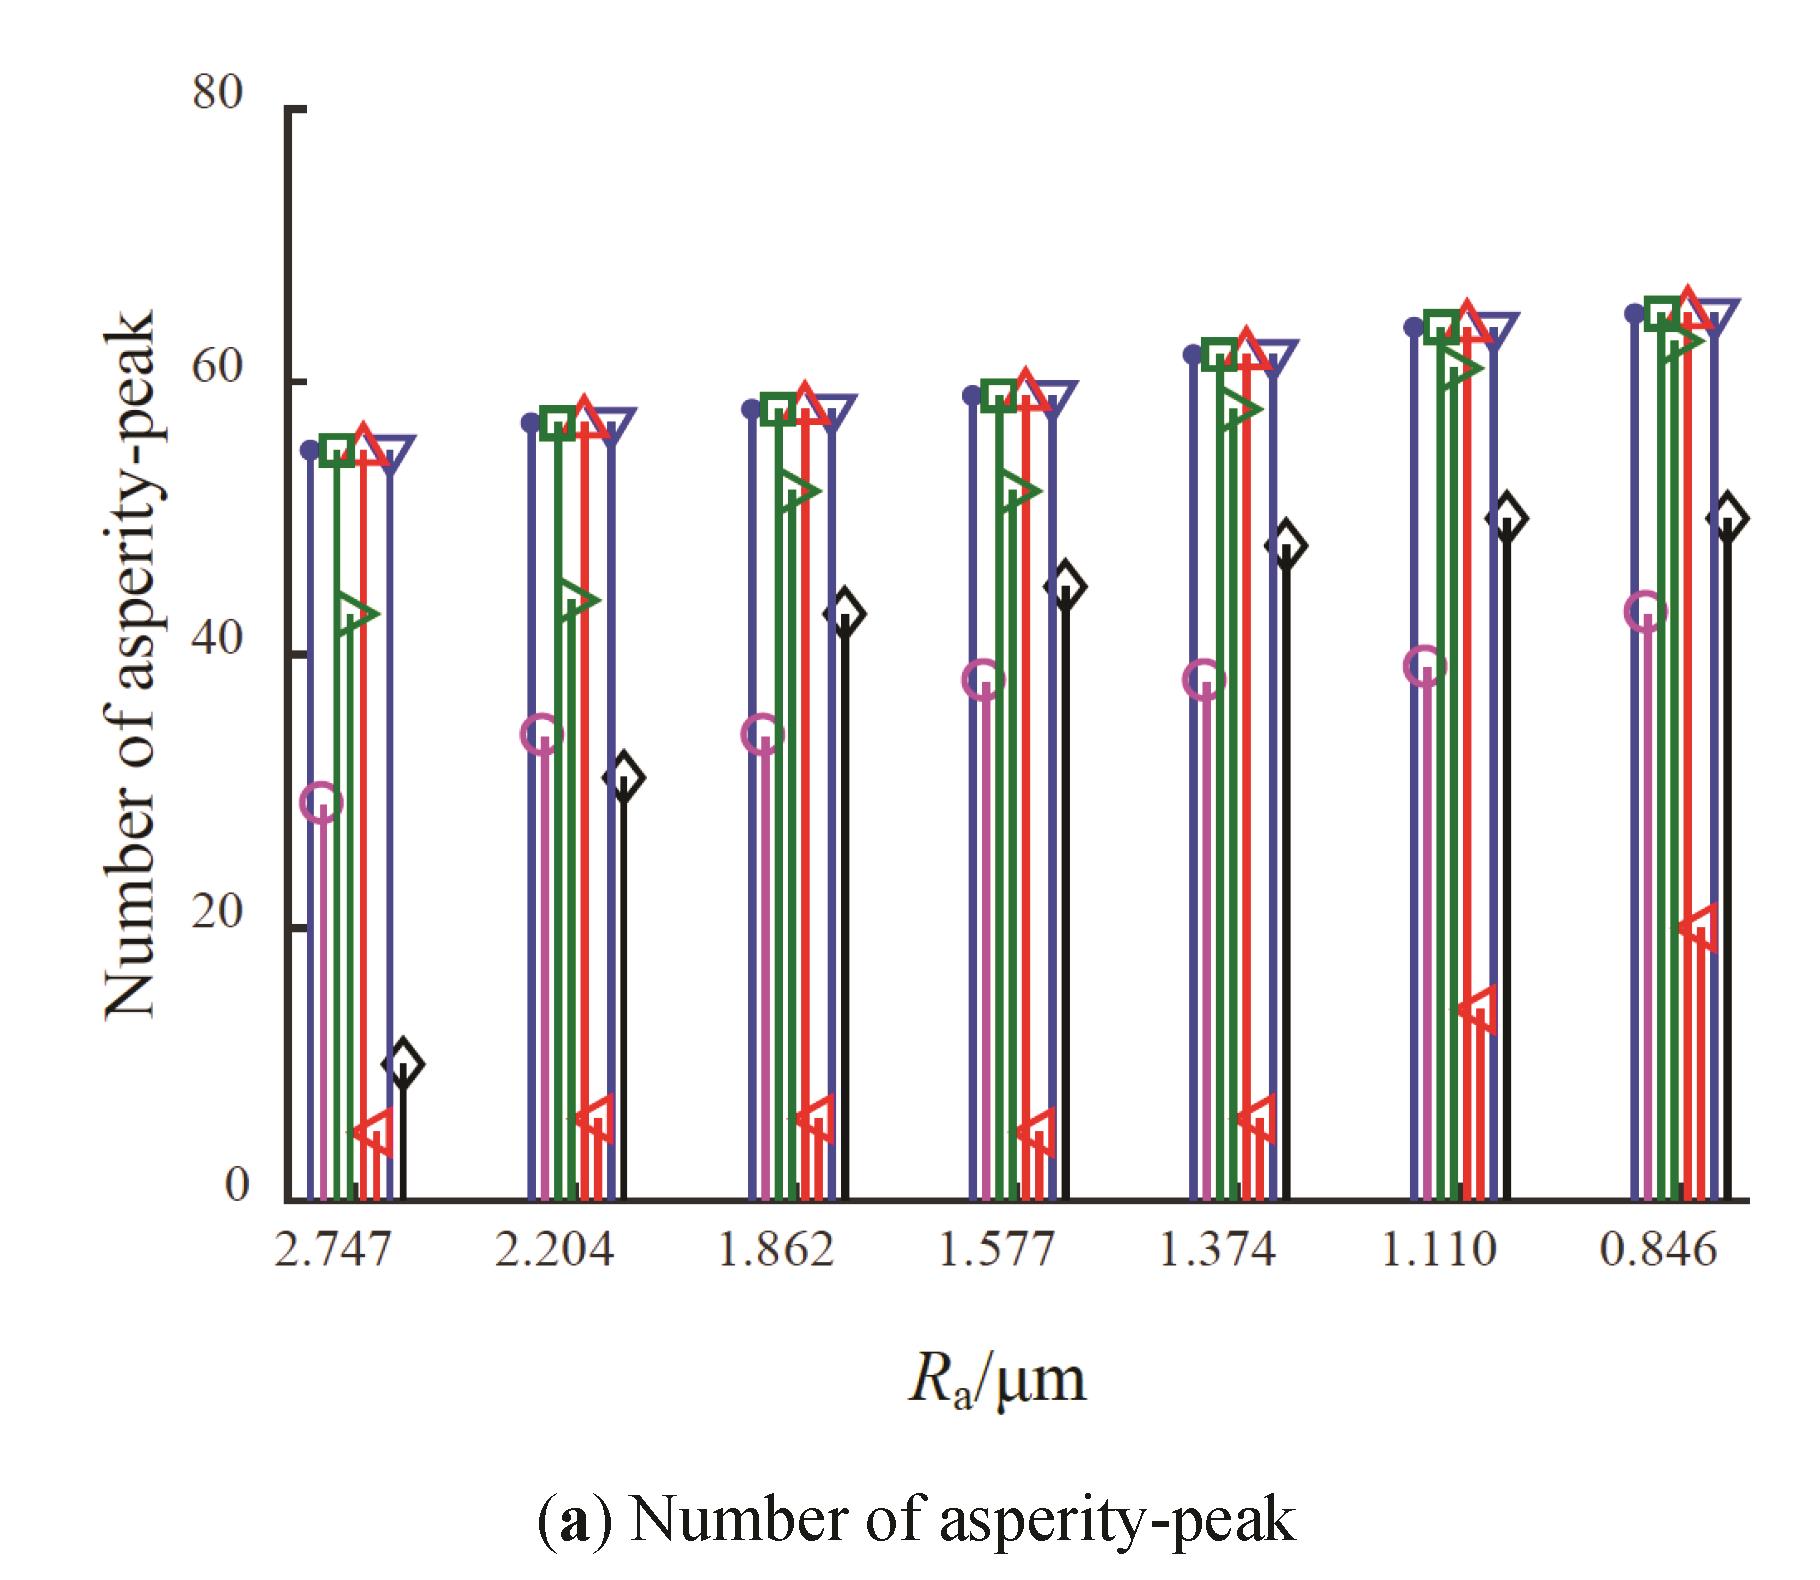
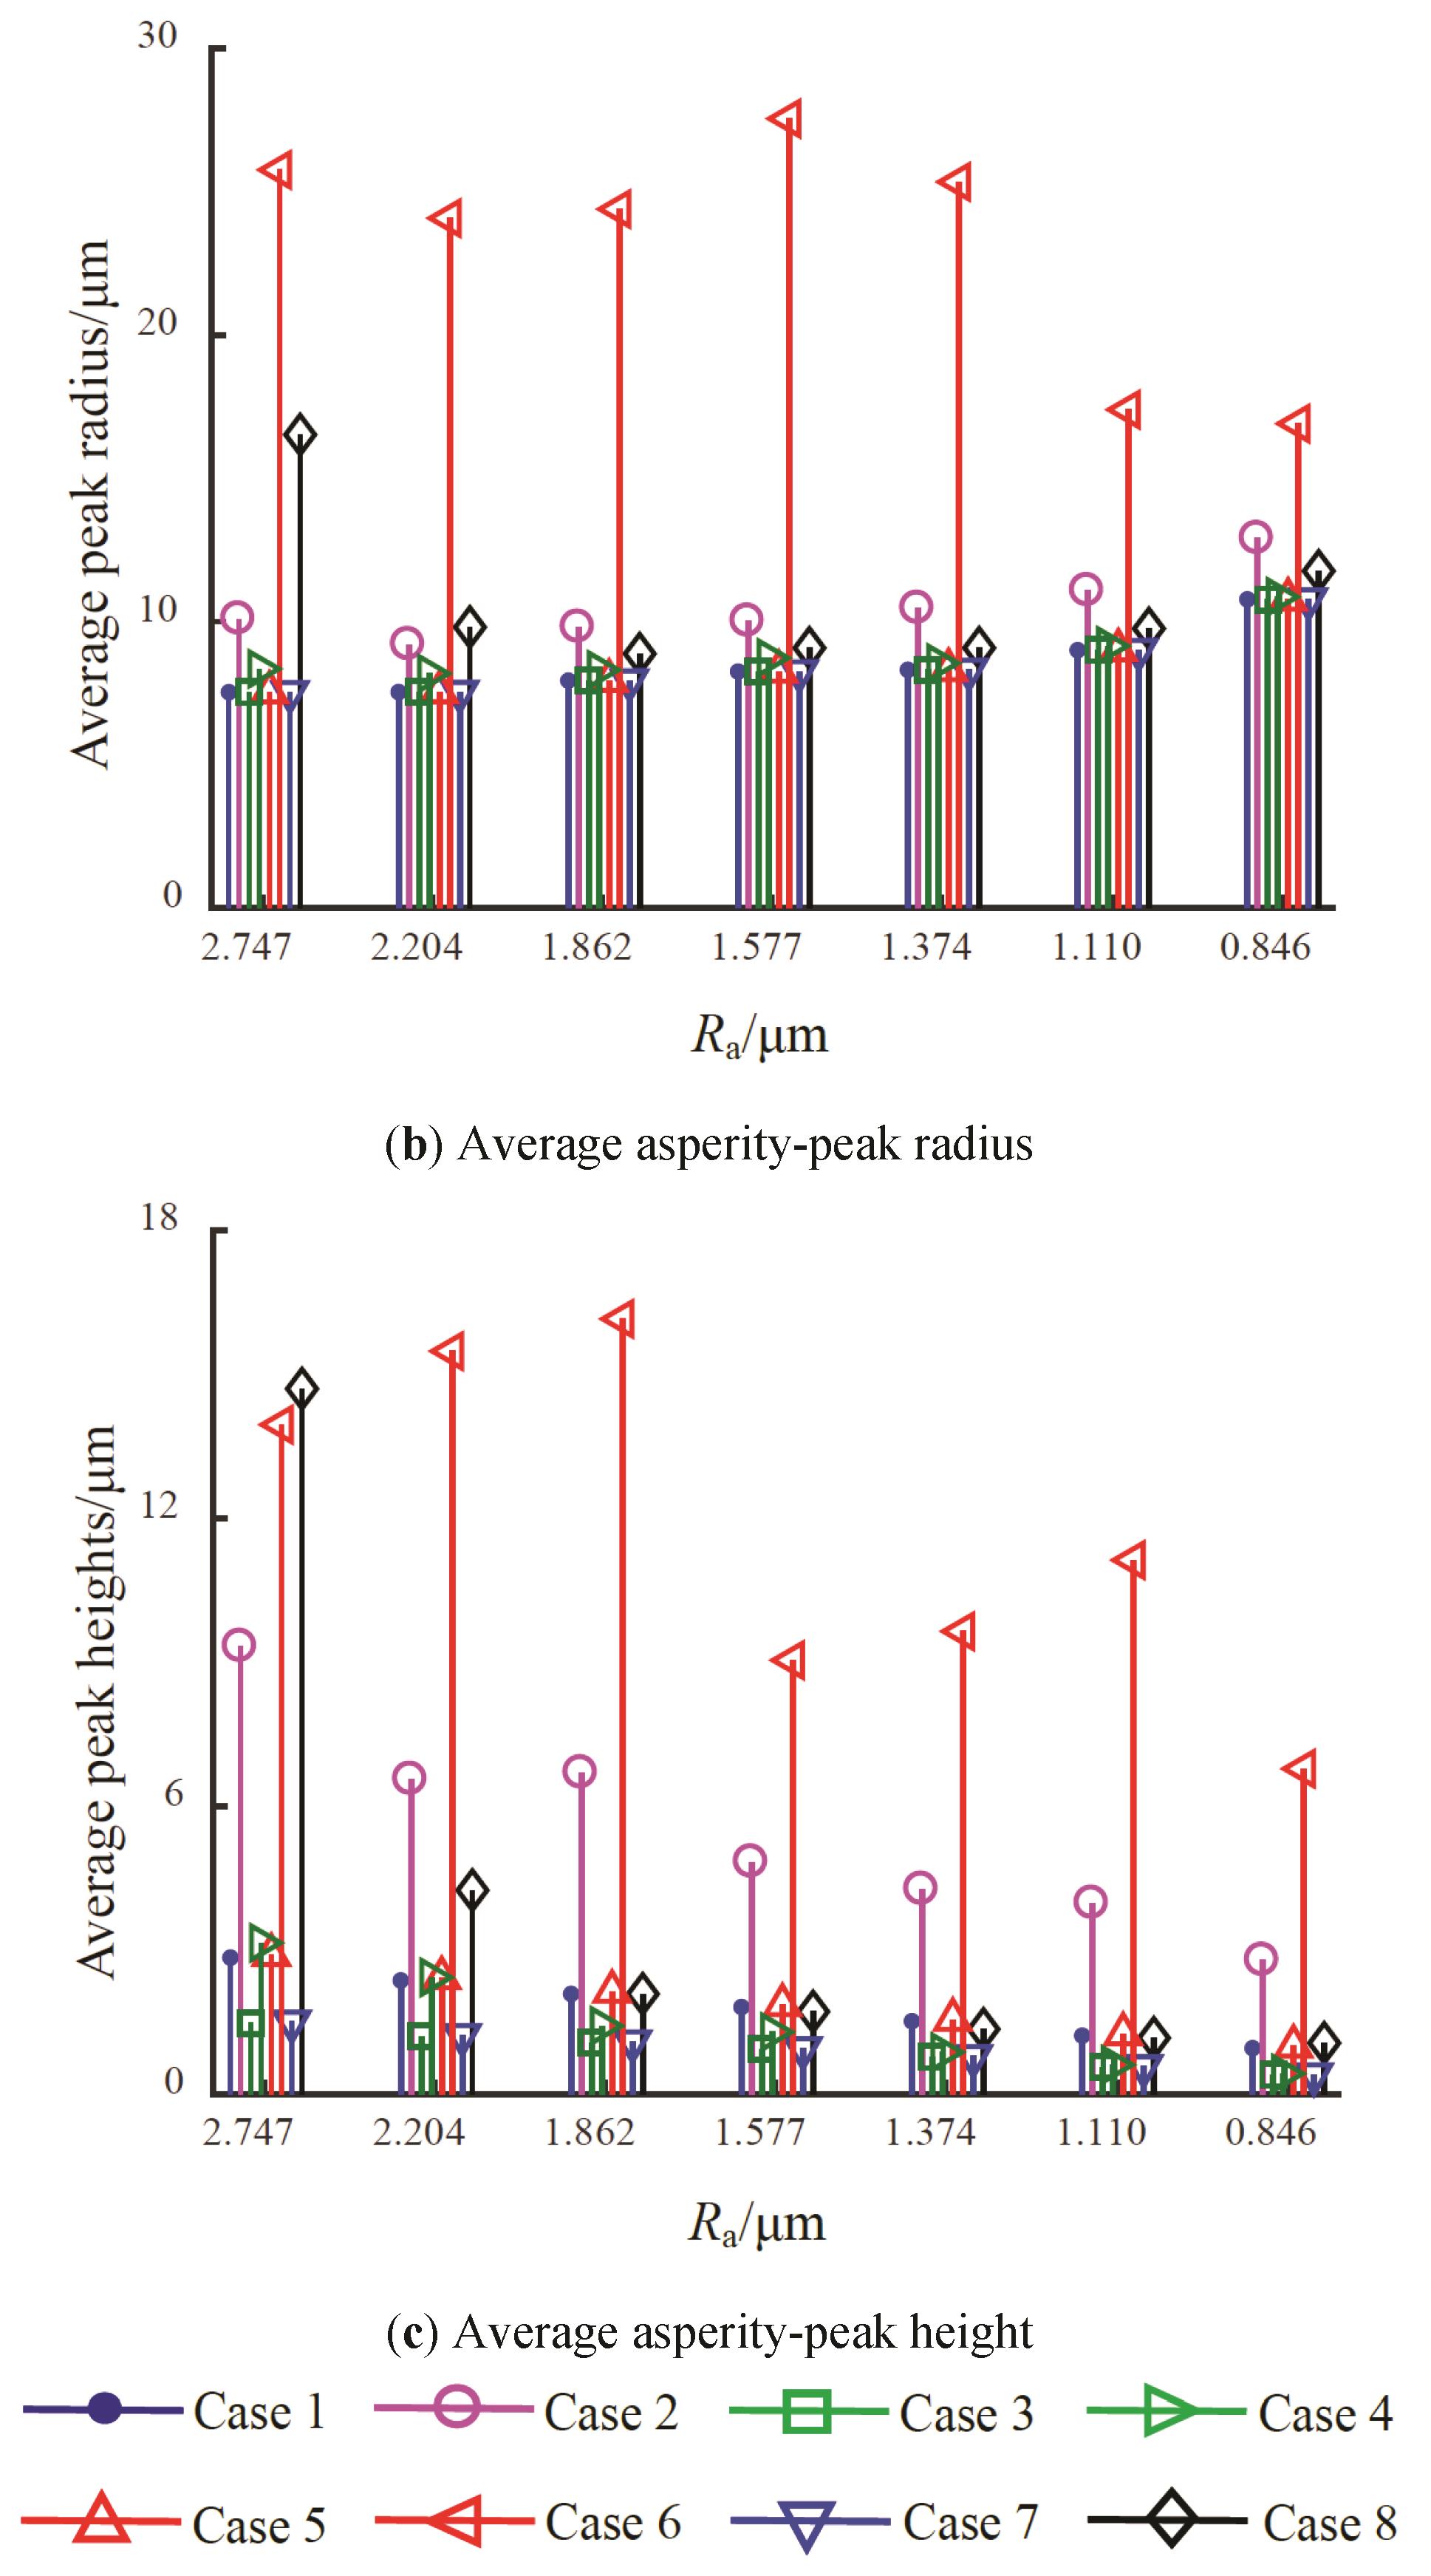
Figure 8. Asperity-peak properties: (a) the number per profile (b) their radii and (c) their heights in relation to different roughnesses.
5. Conclusions
In this work, a new contact model that includes the effects of the substrate deformation, thermal deformation and asperity interaction is developed to analyze the change laws of the asperity-peak properties in the sliding process of the rough surfaces. The following conclusions can be drawn:
(1) For different research schemes, the relationship between the contact area and the normal load is linear, which can be validated through the experimental measurements reported in the literature and the results calculated from the classical contact theory.
(2) In contrast to the result of the mutually independent asperity, the substrate deformation decreases the reference baseline. An opposite effect for the thermal deformation and the asperity interaction, which cause the contact materials to expand and bulge.
(3) The effects of the substrate deformation and asperity interaction will become more significant when the greater normal displacements, smaller sampling intervals and roughness values are applied. However, it is more obvious for the thermal deformation when the normal load, sampling interval and roughness value become greater.
Author Contributions: Conceptualization, Q.W.; writing—original draft preparation, S.N. and S.L.; writing—review and editing, J.H. and T.H.; supervision, H.W. and Z.W. All authors have read and agreed to the published version of the manuscript.
Funding: This research was funded by the Commission of Science Technology of Henan Province of China (No. 242102110376), and Henan Agricultural University (No. 30500461).
Data Availability Statement: Not applicable.
Conflicts of Interest: The authors declare no conflict of interest.

References
- Fu, P.; Zhao, J.; Zhang, X.; Miao, H.; Wen, Z.; Wang, P.; Kang, G.; Kan, Q. Elasto-plastic partial slip contact modeling of graded layers. Int. J. Mech. Sci. 2024, 264, 108823. https://doi.org/10.1016/j.ijmecsci.2023.108823.
- Liu, H.; Saksham, D.; Shen, M.; Chen, K.; Wu, V.; Wang, L. Industry 4.0 in metal forming industry towards automotive applications: A review. Int. J. Automot. Manuf. Mater. 2022, 1, 16– 27. https://doi.org/10.53941/ijamm0101002.
- Jiang, C.Y.; Liang, X. M. An incremental contact model for hyperelastic solids with rough surfaces. Tribol. Lett. 2024, 72, 1– 9. https://doi.org/10.21203/rs.3.rs-3163452/v1.
- Li, Y.H.; Shen, F.; Güler, M.A.; Ke, L. L. A rough surface electrical contact model considering the interaction between asperities. Tribol. Int. 2023, 190, 109044. https://doi.org/10.1016/j.triboint.2023.109044.
- Wang, X.; Ma, S.; Dong, W.; Zhao, X.; An, B.; He, Q.; Ding, H.; Wang, P.; Wang, W. Peridynamic modeling of rail wear during sliding contact considering thermal effects. Wear 2023, 532– 533, 205110. https://doi.org/10.1016/j.wear.2023.
- Wang, Q.; Zhang, K.; Wang, Z.; Wang, H.; Sun, Y.; Gao, X.; Xu, G. Contact characteristics and interfacial motion states during sphere oblique impact with initial spin. J. Mech. Sci. Technol. 2023, 37, 2507– 2518. http://doi.org/10.1007/s12206-023-0426-5.
- Sun, X.G.; Xing, W. C. Fractal model of thermal contact conductance of rough surfaces based on cone asperity. Aircr. Eng. Aerosp. Technol. 2023, 95, 966– 973. http://doi.org/10.1108/AEAT-05-2022-0117.
- Greenwood, J.A. A simplified elliptic model of rough surface contact. Wear 2006, 261, 191– 200. https://doi.org/10.1016/j.wear.2005.09.031.
- Greenwood, J.A.; Williamson, J. B.P. Contact of nominally flat surfaces. Proc. R. Soc. Lond. 1966, 295, 300– 319. https://doi.org/10.1098/rspa.1966.0242.
- Wang, Q.; Zhang, L.; Du, B. Re-definition of asperity-peak for deterministic contact model on rough surfaces. J. Xi'an Jiaotong Univ. 2016, 50, 115– 120. https://doi.org/10.7652/xjtuxb201611018.
- Hertz, H. On the contact of elastic solids. J. Fur Die Und Andgewandte Math. 1882, 92, 156– 171. doi: 10.1515/crll.1882.92.156
- Abbott, E.J.; Firestone, F. A. Specifying surface quality: A method based on accurate measurement and comparison. Mech. Eng. 1933, 55, 569– 572.
- Chang, W.R.; Etsion, I.; Bogy, D. B. An elastic-plastic model for the contact of rough surfaces. ASME J. Tribol. 1987, 109, 257– 263. https://doi.org/10.1115/1.3261348.
- Zhao, Y.W.; Lü, Y.M.; Jiang, J. Z. New elastic-plastic model for the contact of rough surfaces. J. Mech. Eng. 2007, 43, 95– 101. https://doi.org/10.3901/JME.2007.03.095.
- Brake, M.R. An analytical elastic plastic contact model with strain hardening and frictional effects for normal and oblique impacts. Int. J. Solids Struct. 2015, 62, 104– 123. https://doi.org/10.1016/j.ijsolstr.2015.02.018.
- Wang, Q.P.; Zhang, L.; Shang, H.C.; Tang, Z. H. Mixed elastic-plastic contact model considering strain hardening. J. Xi’an Jiaotong Univ. 2016, 50, 132– 137. https://doi.org/10.7652/xjtuxb201602022.
- Persson, B.N.J. Contact Mechanics for Randomly Rough Surfaces: On the Validity of the Method of Reduction of Dimensionality. Tribol. Lett. 2015, 58, 1– 4. https://doi.org/10.1007/s11249-015-0498-1.
- Ciavarella, M.; Greenwood, J.A.; Paggi, M. Inclusion of “interaction” in the Greenwood and Williamson contact theory. Wear 2008, 265, 729– 734. https://doi.org/10.1016/j.wear.2008.01.019.
- Yastrebov, V.A.; Anciaux, G.; Molinari, J. F. From infinitesimal to full contact between rough surfaces: Evolution of the contact area. Int. J. Solids Struct. 2015, 52, 83– 102. https://doi.org/10.1016/j.ijsolstr.2014.09.019.
- Tang, Z.; Xia, C.; Song, Y. Joint closure deformation model based on asperity-substrate deformation. Chin. J. Rock Mech. Eng. 2012, 31, 3068– 3074.
- Tian, X.; Wang, W.; Fu, W.; Gao, Z.; Lou, L.; Wu, J.; Li, P. Contact stiffness model of mechanical joint surfaces considering the asperity interactions. J. Mech. Eng. 2017, 53, 149– 159. https://doi.org/10.3901/JME.2017.17.149.
- Afferrante, L.; Carbone, G.; Demelio, G. Interacting and coalescing Hertzian asperities: A new multiasperity contact model. Wear 2012, 278– 279, 28– 33. https://doi.org/10.1016/j.wear.2011.12.013.
- Wang, Q.; Zhang, L.; Chen, B.; Geng, Y. Inclusion of interaction between asperities in deterministic contact model. J. Xi'an Jiaotong Univ. 2018, 52, 91– 97. https://doi.org/10.7652/xjtuxb201803013.
- Yeo, C.D.; Katta, R.R.; Lee, J.; Polycarpou, A. A. Effect of asperity interactions on rough surface elastic contact behavior: Hard film on soft substrate. Tribol. Int. 2010, 43, 1438– 1448. https://doi.org/10.1016/j.triboint.2010.01.021.
- Fischer, J.; Rodrigues, S.J.; Kriegeskorte, M.; Hilse, N.; Illana, E.; Scherer, V.; Tsotsas, E. Particle-particle contact heat transfer models in thermal DEM: A model comparison and experimental validation. Powder Technol. 2023, 429, 118909. https://doi.org/10.1016/j.powtec.2023.118909.
- Wu, Z.; Zhang, Y.; Xu, Y.; Jie, D.; Jackson, R. L. Modeling of flash temperature for elastic sliding contact of single micro-asperity pair. J. Tribol.-Trans. ASME 2024, 146, 011702 . https://doi.org/10.1115/1.4063334.
- Smith, E.H.; Arnell, R. D. A new approach to the calculation of flash temperatures in dry, sliding contacts. Tribol. Lett. 2013, 52, 407– 414. https://doi.org/10.1007/s11249-013-0224-9.
- Rowe, K.G.; Bennett, A.I.; Krick, B.A.; Sawyer, W. G. In situ thermal measurements of sliding contacts. Tribol. Int. 2013, 62, 207– 214. https://doi.org/10.1016/j.triboint.2013.02.028.
- Chandrasekar, S.; Eriten, M.; Polycarpou, A. A. An improved model of asperity interaction in normal contact of rough surfaces. J. Appl. Mech. 2013, 80, 011025 . https://doi.org/10.1115/1.4007142.
- Knothe, K.; Liebelt, S. Determination of temperatures for sliding contact with applications for wheel-rail systems. Wear 1995, 189, 91– 99. https://doi.org/10.1016/0043-1648(95)06666-7.
- Jamari, J.; Schipper, D. J. Experimental investigation of fully plastic contact of a sphere against a hard flat. ASME J. Tribol. 2006, 128, 230– 235. https://doi.org/10.1115/1.2164470.
- Bush, A.W.; Gibson, R.D.; Thomas, T. R. The elastic contact of a rough surface. Wear 1975, 35, 87– 111. https://doi.org/10.1016/0043-1648(75)90145-3.


